
Fig. 4
- ID
- ZDB-FIG-130102-4
- Publication
- Vemaraju et al., 2012 - A spatial and temporal gradient of fgf differentially regulates distinct stages of neural development in the zebrafish inner ear
- Other Figures
- All Figure Page
- Back to All Figure Page
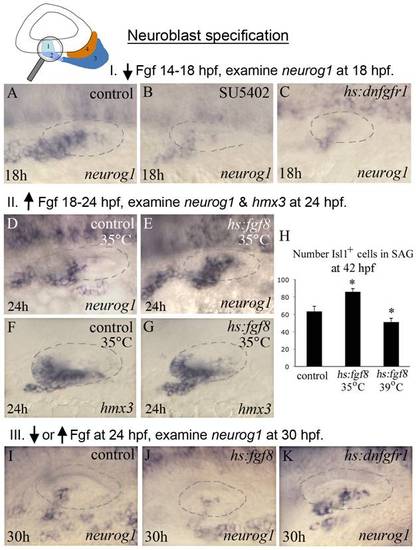
Fgf regulates neuroblast specification. The icon at the top of the figure indicates that analysis focuses on initial stages of neuroblast formation, as normally marked by neurog1 expression. Experimental manipulations in groups I, II and III are briefly summarized at the tops of the corresponding data panels. (A-C) Experiment I, neurog1 expression at 18 hpf in a control (A), SU5402 inhibitor treated (B) and hs:dnfgfr1/+ transgenic embryo heat shocked for 30 minutes at 38°C beginning at 14 hpf. Blocking Fgf strongly reduces expression of neurog1. (D-G) Experiment II, expression of neurog1 (D-E) and hmx3 (F-G) in control and hs:fgf8/+ embryos heat shocked at 35°C for 6 hours, from 18 hpf until 24 hpf. This regimen results in weak overexpression of Fgf8, which at this stage enhances expression of neurog1. (H) Experiment II, total number of Islet1-positive cells in the SAG (mean and standard deviation, n = 15) at 42 hpf following heat shock activation of hs:fgf8 at 18 hpf at indicated temperatures. Weak misexpression of Fgf8 (35°C) increases production of SAG neurons whereas strong misexpression of Fgf8 (39°C) reduces production of SAG neurons. *p<0.001 in comparison to the control, analyzed with Student′s t test. (I–K) Group III, neurog1 expression at 30 hpf following heat shock at 24 hpf in control embryos (I), hs:fgf8/+ embryos heat shocked at 39°C for 30 minutes to strongly over-express Fgf (J) and hs:dnfgfr1/+ embryos heat shocked for 2 hours at 35°C and then shifted to 33°C to maintain low level inhibition of Fgf signaling (K). At this stage, weak impairment of Fgf enhances neurog1 expression, consistent with the idea that Fgf levels normally increase during development and become inhibitory for neuroblast specification. All images show dorsolateral views with anterior to the left, and the otic vesicle is outlined. |
| Genes: | |
|---|---|
| Fish: | |
| Conditions: | |
| Anatomical Terms: | |
| Stage Range: | 14-19 somites to Prim-15 |