
Fig. S2
- ID
- ZDB-FIG-121217-52
- Publication
- Nonet, 2012 - A Window into Domain Amplification Through Piccolo in Teleost Fish
- Other Figures
- All Figure Page
- Back to All Figure Page
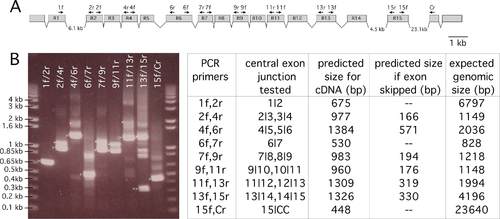
RT-PCR analysis of splicing patterns in the repeated zebrafish zinc finger exons. A) Diagram of the exon structure of the repeated exons encoding zinc finger domains of zebrafish pclob. Name and position of oligonucleotide primers used for RTPCR are also depicted above the representation of the genomic organization. The drawing is to scale except for the 3 large exons, the sizes of which are indicated in the drawing. A 1 kb scale bar is present on the right. B) Agarose gel separation of RT-PCR products obtained from amplification of first strand cDNA from 5dayold zebrafish embryos. On the left is a table that tabulates predicted sizes of PCR products for genomic DNA, pclob cDNA, and cDNA size if an exon is omitted from the mature transcript. > mark DNA bands of the expected size if an exon is spliced as illustrated in A. * mark bands of the expected size of genomic DNA, >> mark the PCR products consistent with skipping of exon R14. The sizes of DNA markers are on the left. |