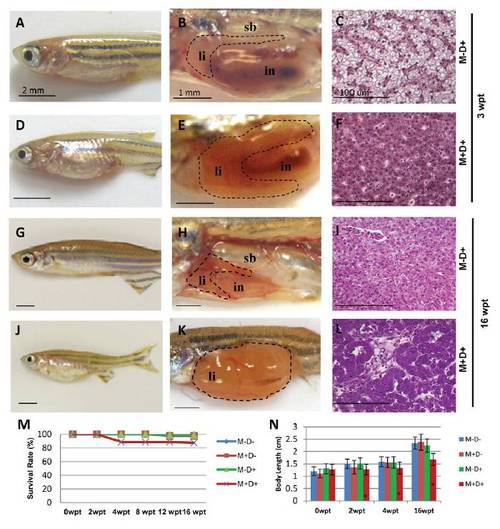
Induction of liver tumors in TO(Myc) fish. (A-L) Transgenic and non-transgenic fish were treated with Dox (60 μg/ml) starting from 21 dpf and sampled at different times. Samples were collected at 3 wpt (A-F) and 16 wpt (G-L). The left column displays external appearance, the middle column shows internal abdominal organs with the livers outlined, and the right column depicts H&E staining of liver sections. At 3 wpt, non-transgenic siblings had normal body shape (A), whereas transgenic fish showed an enlarged belly (D). Dissection of a transgenic fish (E) showed an enlarged abdomen compared to a non-transgenic sibling (B). At 16 wpt, more obviously enlarged abdomen (J) and fully grown liver tumor (K) were observed, in comparison with the controls (G,H). Histological examination confirmed that most transgenic fish developed hyperplasia (F) at 3 wpt and adenoma (L) at 16 wpt in comparison with normal liver histology in non-transgenic siblings (C,I). (M,N) Survival curves (M) and body lengths (N) for the four experimental groups until 16 wpt. Noted body length was significantly different from the control group after just 2 weeks of treatment; *P<0.0001. li, liver; in, intestine; sb, swimbladder. Scale bars: 2 mm, 1 mm and 100 μm for the left, middle and right columns, respectively.
|
