
Fig. 5
- ID
- ZDB-FIG-121205-28
- Publication
- Itou et al., 2012 - Migration of cardiomyocytes is essential for heart regeneration in zebrafish
- Other Figures
- All Figure Page
- Back to All Figure Page
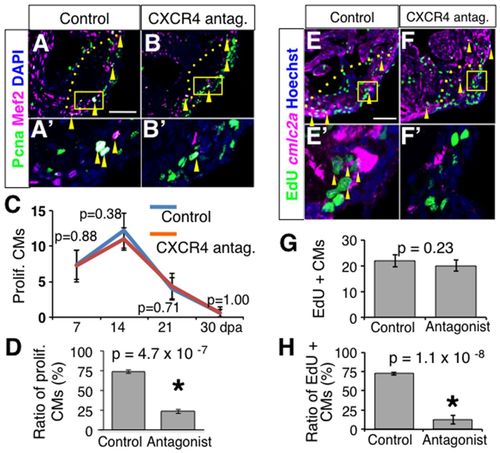
Blocking Cxcr4 function causes mis-localization of proliferating CMs. (A-B′) Pcna (green) and Mef2 (magenta) staining of control (A,A2) and CXCR4-antagonist-treated (B,B′) hearts at 14 dpa. The yellow arrowheads point to proliferating CMs seen as white signal. A ′ and B2 show close up of the boxed area in A and B. For simplicity, not all proliferating CMs are labeled. (C) Quantitation of the number of proliferating CMs in control and CXCR4-antagonist-treated hearts at 7, 14, 21 and 30 dpa. The vertical axis represents the number of proliferating CMs per section. A section that represents the largest injury area at the center of the injury site of each heart was examined (n=5). P-values at each time point are shown. (D) Quantitation of the ratio of proliferating CMs in the injury site compared with the number of entire proliferating CMs in control and CXCR4 antagonist-treated hearts at 14 dpa. The same samples examined in C were used. (E-F′) EdU (green) and cmlc2a-mCherry (magenta) signal of control (E,E′) and CXCR4 antagonist-treated (F,F′) hearts at 13 dpa. The yellow arrowheads point to proliferating CMs seen as white signal. For simplicity, not all proliferating CMs are labeled. E′ and F′ show close up of the boxed area in E and F. (G) Quantitation of the number of EdU/cmlc2a-mCherry double-positive cells in control and CXCR4 antagonist-treated hearts at 13 dpa. Vertical axis represents the number of proliferating CMs per section. A section that represents the largest injury area at the center of the injury site of each heart was examined (n=5). (H) Quantitation of the ratio of EdU-positive CMs in the injury site compared with the number of entire EdU-positive CMs in control and CXCR4-antagonist-treated hearts at 13 dpa. The same samples examined in G were used. For D, G and H, P-values by Student′s t-test are shown. Dotted lines in A, B, E and F indicate the amputation planes. Scale bars: 50 μm. |