
Fig. 2
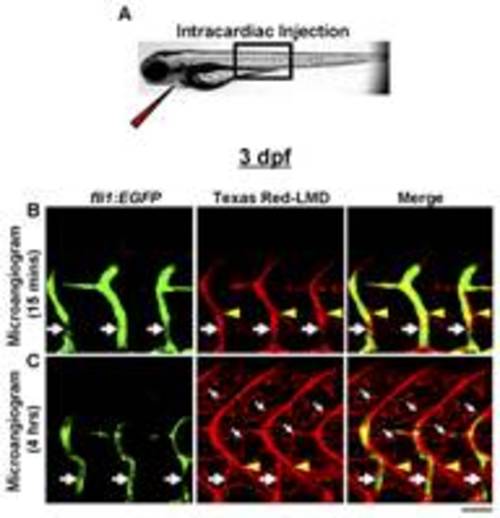
Late-phase microangiography clearly demonstrates lymphatic capillaries in early zebrafish development. A, Intracardiac injection technique employed for microangiography. The narrow red triangle represents the needle used to inject Texas Red-LMD into the zebrafish heart. The black box demarcates the approximate region of the trunk imaged. B and C, Microangiogram of 3-dpf Tg(fli1:EGFP)y1 zebrafish. B, At 15 minutes post-injection (early-phase), Texas Red-LMD is primarily within ISVs (large white arrows), and lymphatic capillaries contain no Texas Red-LMD. C, By 4 hours post-injection (late-phase), most Texas Red-LMD has leaked from the blood vessels and collected at somitic boundaries (yellow arrowheads) or within deep lymphatic capillaries (small white arrows). Scale bar, 50 μm. |