
Fig. 1
- ID
- ZDB-FIG-120831-1
- Publication
- Delaurier et al., 2012 - Histone deacetylase-4 is required during early cranial neural crest development for generation of the zebrafish palatal skeleton
- Other Figures
- All Figure Page
- Back to All Figure Page
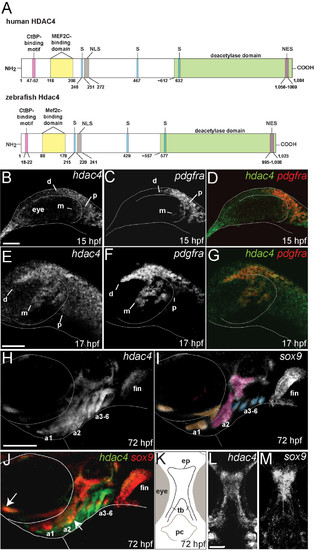
Identification of zebrafish Hdac4 and characterization of mRNA expression in the developing head. (A) Zebrafish Hdac4 protein contains functional domains conserved with human HDAC4, including nuclear localization (NLS), nuclear export (NES), and phosphorylation (S) sites [22-24, 26]. (B-J) mRNA in situ hybridizations, anterior is to the left, dorsal is up. Images are projections from confocal stacks taken from the left side of the embryo. (L and M) Images are projections from confocal stacks of dissected flat-mounts, ventral side facing upwards. (B) hdac4 mRNA is expressed throughout the head at 15 hpf, with expression posterior (p) and dorsal (d) to the eye. Transcript for hdac4 is also expressed medial to the eye (m). (C) pdgfra mRNA expression at 15 hpf, posterior to the eye (p), dorsal to the eye (d), and medial to the eye (m). (D) hdac4 and pdgfra are co-expressed at 15 hpf. (E-G) hdac4 and pdgfra mRNAs are co-expressed at 17 hpf in three streams of expression, including dorsal to the eye (d), posterior to the eye (p), and medial to the eye (m). (H) At 72 hpf, hdac4 mRNA is expressed throughout the pharyngeal arches (a1, a2, a3-6) and the pectoral fin. (I) sox9 mRNA is expressed in developing cartilage (arch 1 (a1) derivatives pseudocolored in tan, arch 2 (a2) magenta, and arches 3–6 (a3-6) blue). (J) hdac4 mRNA is co-expressed with sox9 in some regions of arch 1 and 2 cartilages (indicated by white arrows), but primarily surrounds sox9-expressing chondrocytes in arches 3–6. (K) Schematic of ventral view of dissected embryo at 72hpf showing the ethmoid plate (ep) and trabeculae (tb) of the palatal skeleton, and pharyngeal cavity (pc). (L and M) hdac4 mRNA is expressed in the ethmoid plate and trabeculae of the palatal skeleton. (M) sox9 is expressed in the ethmoid plate. B-G: scale bar = 50 μm, H-J: scale bar = 200 μm, L and M: scale bar = 50 μm. |
| Genes: | |
|---|---|
| Fish: | |
| Anatomical Terms: | |
| Stage Range: | 10-13 somites to Protruding-mouth |