
Fig. 2
- ID
- ZDB-FIG-120803-18
- Publication
- Stückemann et al., 2012 - Zebrafish Cxcr4a determines the proliferative response to Hedgehog signalling
- Other Figures
- All Figure Page
- Back to All Figure Page
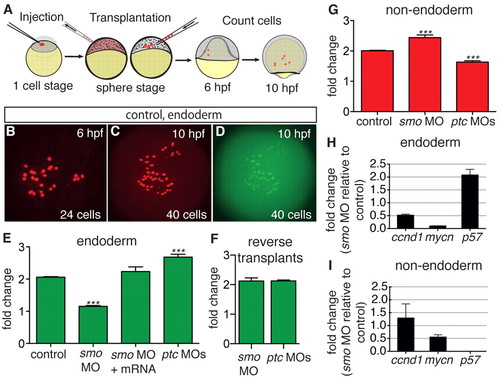
Hh promotes cell cycle progression in the endoderm but not in non-endodermal cells. (A) Outline of transplant assay. Rhodamine-dextran-positive donor cells are transplanted into host zebrafish embryos and counted at the beginning (6 hpf) and at the end (10 hpf) of gastrulation. The fold change is taken as a measure of donor cell proliferation. (B-D) A host embryo with transplanted control endodermal donor cells (Rhodamine-dextran, red) at 6 hpf (B) and 10 hpf (C). Control endodermal cells double in number during gastrulation and express Tg(sox17:EGFP) at 10 hpf (D). (E,F) Quantification of transplant assay results with injected endodermal donor cells in a wt host background (E) and wt endodermal donor cells in a morphant host background (F). (G) Quantification of transplant assay using injected non-endodermal donor cells in wt host background. (E-G) Bars show mean fold change from at least three independent experiments; error bars show s.e.m. n values for each experiment are given in supplementary material Table S2. ***P<0.001; one-way ANOVA analysis. (H,I) qRT-PCR analysis of FACS sorted Tg(sox17:EGFP)-positive (endoderm, H) and -negative (non-endoderm, I) smo morphant samples compared with uninjected control samples. Bars show mean fold change; error bars indicate s.e.m. |