
Fig. 2
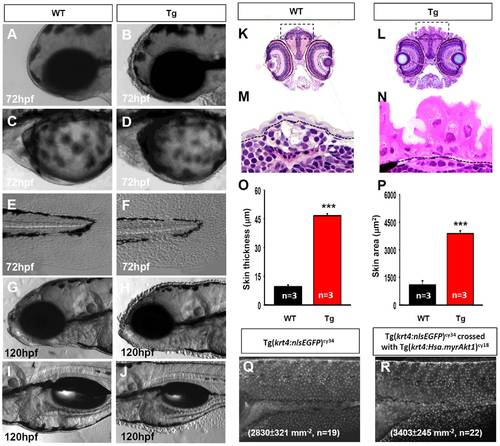
Tg(krt4:Hsa.myrAkt1)cy18 fish display skin hypertrophy and hyperplasia at the embryonic stage. Microscopic pictures of skin epidermis near the head regions (A, B), pericardial cavity and yolk sac (C, D), and tail fin (E, F) of either WT (A, C, E) or Tg(krt4:Hsa.myrAkt1)cy18 (B, D, F) at 72 hpf. At 120 hpf, the protruding appearance of skin covering the head (H) and yolk sac (J) was more pronounced in Tg than their wild-type siblings (G, I). Skin histology of WT (K, M) and Tg(L, N) embryos at 120 hpf. Cross sections through the eye position are stained with hematoxylin and eosin. The areas highlighted by a dotted line in K and L are magnified in M and N, respectively. Quantitative comparison of skin thickness (O) and area (P) between WT (black bar) and Tg (red bar). (Q, R) Quantitative comparison of skin density between Tg(krt4:nlsEGFP)cy34 and double transgenics of Tg(krt4:nlsEGFP)cy34;Tg(krt4:Hsa.myrAkt1)cy18 at 120 hpf. ***p<0.001. Data were analyzed by Student’s t-test and are shown as mean ±SEM. hpf, hour post-fertilization; WT, wild type; Tg, Tg(krt4:Hsa.myrAkt1)cy18. |
| Fish: | |
|---|---|
| Observed In: | |
| Stage Range: | Protruding-mouth to Day 5 |