
FIGURE
Fig. 1
- ID
- ZDB-FIG-120511-19
- Publication
- Ritter et al., 2012 - Transcriptional enhancers in protein-coding exons of vertebrate developmental genes
- Other Figures
- All Figure Page
- Back to All Figure Page
Fig. 1
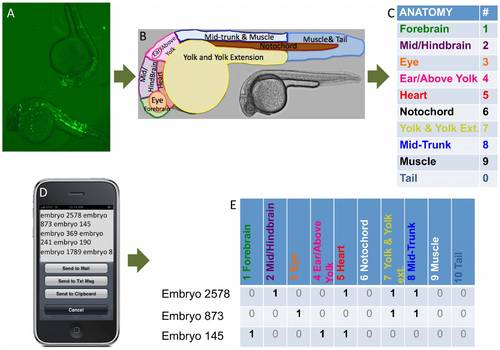
Overview of EGFP expression scoring process. (A) Zebrafish with eGFP expression are scored using a (B) limited anatomy corresponding to (C) numerical values. (D) These are interpreted using the iPhone app Dragon Dictation. (E) A PERL script transforms text into numerical strings representing embryo expression in each anatomy. These data are analyzed to determine anatomical regions with significant expression for each CCE via a proportions test and a Wilcoxon rank-sum test (see Methods and Supplementary Data File S2). |
Expression Data
Expression Detail
Antibody Labeling
Phenotype Data
Phenotype Detail
Acknowledgments
This image is the copyrighted work of the attributed author or publisher, and
ZFIN has permission only to display this image to its users.
Additional permissions should be obtained from the applicable author or publisher of the image.
Full text @ PLoS One