
Fig. 5
- ID
- ZDB-FIG-120417-10
- Publication
- Voz et al., 2012 - Fast Homozygosity Mapping and Identification of a Zebrafish ENU-Induced Mutation by Whole-Genome Sequencing
- Other Figures
- All Figure Page
- Back to All Figure Page
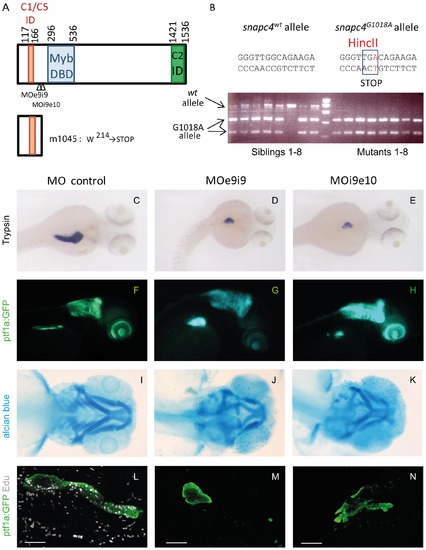
A nonsense mutation in the ORF of snapc4 is the m1045 causal mutation. A) Schematic scheme of the zebrafish Snapc4 protein. The conserved Myb DNA binding domain and the interacting domains for Snapc1/snapc5 and Snapc2 as described for the human SNAPC4 ([16], [17] are indicated by boxes. The m1045 mutation generates a premature stop codon in the zebrafish snapc4 cDNA resulting in a truncated protein of 213 aa. The positions targeted by the MOe9i9 and MOi9e10 snapc4 morpholinos are indicated with arrowheads. B) Genotyping of m1045 mutant and unaffected sibling embryos by RFLP analysis. C–N) Phenotype of embryos injected with 8 ng of control morpholino, 8 ng of MOe9i9 or 6 ng of MOi9e10 snapc4 morpholinos. C–E) Dorsal view of WISH performed with a trypsin probe of 3.5 dpf larvae: 84% of the control morphants display a complete extension of the pancreatic exocrine tail (n = 19) while 52% of MOe9i9 morphants show a drastic reduction of the pancreatic exocrine tail and 48% no extension at all (n = 19) and 9% of MOi9e10 morphants show a drastic reduction of the pancreatic exocrine tail and 91% no extension at all (n = 23). F–H) Lateral view of 3.5 dpf Ptf1:GFP larvae: 95% of the control morphants display a complete extension of the pancreatic exocrine tail (n = 25) while 13% of MOe9i9 morphants show a drastic reduction of the pancreatic exocrine tail and 87% no extension at all (n = 83) and 24% of MOi9e10 morphants show a drastic reduction of the pancreatic exocrine tail and 62% no extension at all (n = 55). I–K) Alcian blue staining of 4 dpf embryos: MOe9i9 and MOi9e10 morphants display a reduction and malformation of the hyoid concomitant with the absence of the branchial arches 3 to 7. L–N) Confocal projections of the pancreatic region of embryos injected with Edu at 95 hpf and fixed at 96 hpf. All the control morphants show a high Edu incorporation rate (n = 15). 95% of the MOe9i9 morphants did not incorporate any Edu at all (n = 19) and 43% of the MOi9e10 morphants display no incorporation at all and 21% a considerably reduced incorporation rate (n = 14). Scale bars : 50 μm. |
| Genes: | |
|---|---|
| Fish: | |
| Knockdown Reagents: | |
| Anatomical Terms: | |
| Stage: | Protruding-mouth |
| Fish: | |
|---|---|
| Knockdown Reagents: | |
| Observed In: | |
| Stage: | Protruding-mouth |