Distribution of Annexins in the Lesion and the anxa6 Morphant Phenotype
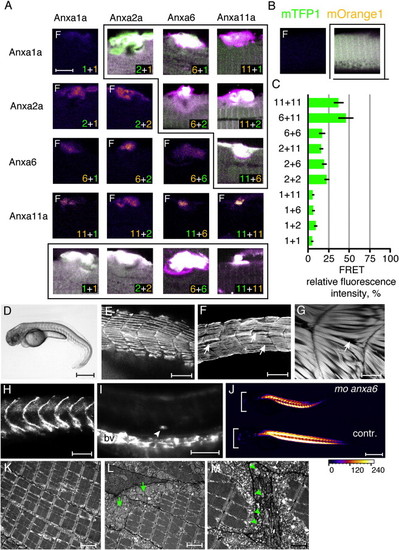
(A) FRET was carried out to map the spatial distribution of annexins at high resolution. The lower triangle demonstrates FRET signal (designated as F), upper triangle and lower panel (surrounded by boxes) show the extent of damage by the colocalization of the two proteins. In each panel, the combination of annexins coexpressed are indicated by numbers (1: Anxa1a; 2: Anxa2a; 6: Anxa6; 11: Anxa11a), and the color identifies the fusion to mTFP1 (green) or mOrange1 (orange).
(B) Control of FRET experiments. No FRET (left) when mOrange1 and mTFP1 were coexpressed without fusion to annexins. Overlay of mOrange and mTFP1 is shown on the right.
(C) Quantitative analysis of FRET signal intensity in the lesion (mean of five experiments).
(D) Injection of anxa6 morpholino leads to curved trunk by 3 days of development.
(E and F) Slow muscle myosin staining (F59 antibody) shows largely normal muscle development at 24 hpf (E), but reveals gaps (arrows) between myofibers at 72 hpf (F).
(G) Deeper muscle sections were visualized with phalloidin-stained actin. Curved myofibers and gaps (arrows) were evident.(H) β-sarcoglycan staining of obtuse myoseptal angles.(I) Only very few cells (arrowhead) in the muscle tissue of anxa6 morphants became penetrable to Evans blue dye. bv, blood vessel.
(J) Birefringence is only moderately affected in anxa6 morphants.
(K–M) Electron microscopy of anxa6 morphant myofibers. Cell membrane is electron dense. In large areas, proper myofibril organization was present (K), whereas occasional damage could also be detected (L, arrows). (M) shows accumulation of vesicles (arrowheads) at the site of myofiber damage. Orientation of embryos (D–J): anterior left, dorsal up.
Scale bars represent 6 μm (A and B); 500 μm (D and J); 80 μm (E, F, H, and I); 20 μm (G); 2 μm (K and L); 1 μm (M). See also Figure S1.
|
