
Fig. 1
- ID
- ZDB-FIG-120323-11
- Publication
- Caneparo et al., 2011 - Intercellular bridges in vertebrate gastrulation
- Other Figures
- All Figure Page
- Back to All Figure Page
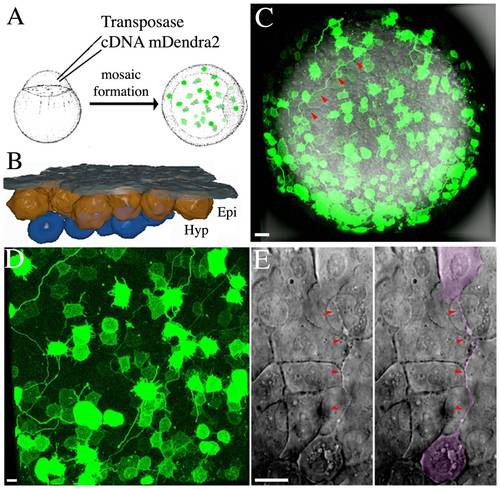
Cellular Bridge Visualisation During Gastrulation. (A) Schematic illustration of the methodology used to generate mosaic embryos with high levels of mDendra2 expression using Tol2 transposase mediated integration of an expression vector. (B) Schematic cross section of an idealized embryo at mid-gastrula stage showing the relationship between the enveloping layer (EVL; dark grey), the epiblast (Epi; orange) and the underlying migrating hypoblast (Hyp; blue). (C) Animal pole of a mosaic zebrafish embryo expressing mDendra2 at the onset of gastrulation. (D) Portion of the animal pole view, showing details of the epiblast layer with intercellular bridges depicted in D, at higher magnification. (E) DIC image of an un-injected embryo showing two epiblast cells connected by an intercellular bridge (red arrow) and highlighted in the right panel of the image in magenta. Schematics are not to scale. Scale bar (C–E): 20 μm. |