
Fig. 3
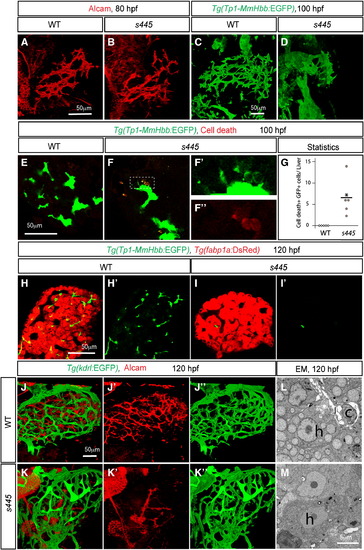
The intrahepatic biliary network disappears in s445 mutant larvae. Projected (A–D and J–K) and z-plane (E–F and H–I) confocal images of the liver at 80 (A and B), 100 (C–F) and 120 (H–K) hpf. Ventral views, anterior to the top. (A and B) Wild-type (A) and s445 mutant (B) larvae visualized for Alcam expression. The Alcam-positive intrahepatic biliary network in s445 mutant larvae is indistinguishable from that of wild-type at 80 hpf. (C and D) Wild-type (C) and s445 mutant (D) Tg(Tp1-MmHbb:EGFP)um14 larvae visualized for GFP expression. Tg(Tp1-MmHbb:EGFP)um14 expression in the liver is restricted to the intrahepatic biliary network at 100 hpf. The intrahepatic biliary network in s445 mutant appears to be degenerating at this stage. (E and F) Wild-type (E) and s445 mutant (F) Tg(Tp1-MmHbb:EGFP)um14 larvae stained for red fluorescent TUNEL. GFP expression and TUNEL signals in the outlined area are magnified and shown separately in F2 and F3, respectively. (G) Number of TUNEL positive Tg(Tp1-MmHbb:EGFP)um14 expressing cells in the wild-type (open square) and s445 mutant (closed circle) liver. *, p < 0.05. (H and I) Wild-type (H) and s445 (I) mutant Tg(Tp1-MmHbb:EGFP)um14; Tg(fabp1a:DsRed)gz15 larvae visualized for GFP and DsRed expressions. Tg(Tp1-MmHbb:EGFP)um14 expressing biliary epithelial cells have largely disappeared from s445 mutant livers by 120 hpf, while Tg(fabp1a:DsRed)gz15 expressing hepatocytes remain. GFP expression is shown separately in H2 and I2. (J and K) Wild-type (J) and s445 mutant (K) Tg(kdrl:EGFP)s843 larvae visualized for GFP (green) and Alcam (red) expressions. The Tg(kdrl:EGFP)s843-expressing intrahepatic vascular network is relatively unaffected while the Alcam-expressing intrahepatic biliary network is severely affected in s445 mutant larvae. Alcam and GFP expressions are shown separately in (J2 and K2) and (J3 and K3), respectively. (L and M) Electron micrographs of the wild-type (L) and s445 mutant (M) liver at 120 hpf. h, hepatocyte; c, cholangiocyte; l, the lumen of the cholangiocyte. |
| Genes: | |
|---|---|
| Antibody: | |
| Fish: | |
| Anatomical Terms: | |
| Stage Range: | Protruding-mouth to Day 5 |
| Fish: | |
|---|---|
| Observed In: | |
| Stage Range: | Protruding-mouth to Day 5 |
Reprinted from Developmental Biology, 363(1), Schaub, M., Nussbaum, J., Verkade, H., Ober, E.A., Stainier, D.Y., and Sakaguchi, T.F., Mutation of zebrafish Snapc4 is associated with loss of the intrahepatic biliary network, 128-137, Copyright (2012) with permission from Elsevier. Full text @ Dev. Biol.