
FIGURE
Fig. 3
- ID
- ZDB-FIG-120305-3
- Publication
- Odermatt et al., 2012 - Encoding of luminance and contrast by linear and nonlinear synapses in the retina
- Other Figures
- All Figure Page
- Back to All Figure Page
Fig. 3
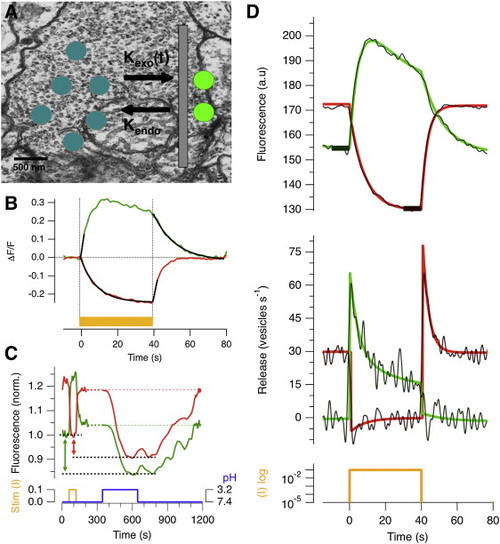
Calculating the Rate of Vesicle Release from sypHy Signals (A) Electron micrographs indicate that there are about 15,000 vesicles in an average bipolar cell terminal (background). The number of unquenched sypHy molecules on the surface depends on both the rate of exocytosis and the rate of endocytosis (foreground).(B) Estimating the rate of endocytosis in vivo: comparison of the sypHy signal in response to a bright step of light (ND 1) averaged from a population of 95 ON terminals (green) and 272 OFF terminals (red). In OFF terminals, the sypHy signal decayed exponentially with τ ~10 s (black line). In ON terminals, the signal decayed at the same rate when the light step was turned off. In both channels, acceleration of vesicle release generated a sypHy signal that rose at a constant average rate for the first 2 s (black lines).(C) Estimation of the sypHy surface fraction (αmin) by acid quenching. First, responses to a step of bright light (ND 1) were measured in ON and OFF terminals at pH 7.4. Then, sypHy molecules on the surface in darkness were quenched with a solution at pH 3.2. The difference between the minimum fluorescence at pH 7.4 and pH 3.2 reflects quenching of the surface fraction (dashed lines). Traces averaged from 10 fish. αmin averaged 0.8% in ON and OFF terminals (see also Figure S3).(D) Upper traces: average fluorescence response of ON (green) and OFF (red) terminals to a 40 s light step (ND 1). The response and recovery phases could both be described as double-exponential functions (smooth lines). Lower traces: a comparison is shown of the conversion of the fluorescence response to rates of vesicle release, Vexo(t), using the raw sypHy signal (noisy trace) and the fitted traces that minimize noise. Thick black bars in upper graph show the values of Fmin used for this calculation, as described in Experimental Procedures. |
Expression Data
Expression Detail
Antibody Labeling
Phenotype Data
Phenotype Detail
Acknowledgments
This image is the copyrighted work of the attributed author or publisher, and
ZFIN has permission only to display this image to its users.
Additional permissions should be obtained from the applicable author or publisher of the image.
Full text @ Neuron