
Fig. 1
- ID
- ZDB-FIG-120207-2
- Publication
- Amir-Zilberstein et al., 2012 - Homeodomain protein otp and activity-dependent splicing modulate neuronal adaptation to stress
- Other Figures
- All Figure Page
- Back to All Figure Page
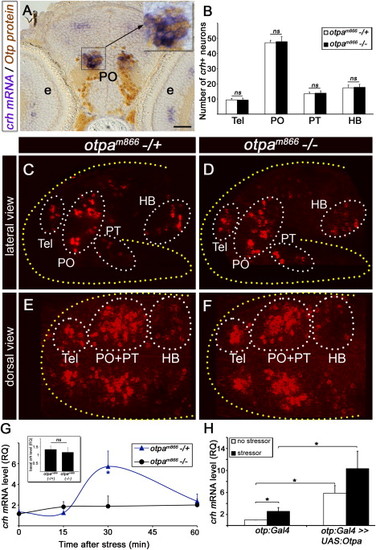
Otp Mediates Stress Response (A) Coronal sections (6 μm) through the PO showing colocalization of Otp and crh in a 6-day-old zebrafish larvae. Larvae were subjected to whole-mount in situ hybridization with a crh-directed probe followed by sectioning and immunostaining with an anti-Otp antibody. High magnification of the crh+;Otp+ area (black rectangle) is shown in the inset. (B) Histogram showing average cell counts in individual CRH+ neuronal clusters of a null zebrafish mutant allele, otpam866-/- (n = 20) compared to heterozygous otpam866-/+ siblings (n = 19). ns, not significant. (C–F) Projected confocal z stack images of CRH neurons in otpam866-/- (D and F) and otpam866-/+ siblings (C and E), acquired from lateral (C and D) and dorsal (E and F) angles. Neurons were visualized by fluorescent in situ hybridization of crh mRNA. (G) Induction of crh mRNA by homeostatic challenge. Physical stressor was applied to 6-day-old progenies of an otpam866-/+ cross for a period of 4 min. The amount of crh mRNA was measured in individual fish larvae at different time points of recovery using quantitative PCR (qPCR). Each tested larva was then genotyped by sequencing and crh mRNA levels of mutant (-/-) and heterozygous (-/+) animals were plotted accordingly. -p < 0.05; n = 8. (H) Gain of function of Otpa in Otp-positive neurons. Physical stress challenge was applied to either a transgenic otp:Gal4 embryos expressing Gal4 in Otp+ cells or their siblings, which were injected with a transposon-based plasmid vector containing the full-length cDNA encoding the otpa gene under the control of ten UAS elements (otp:Gal4 >> UAS:otpa). The amount of crh mRNA was measured using qPCR. -p < 0.05, n = 8. The following abbreviations are used: e, eye; HB, hindbrain; PO, preoptic area; PT, posterior tuberculum; RQ, relative quantity; Tel, telencephalon. Scale bar represents 50 μm in (A) and 100 μm in (C)–(F). |