
Fig. 1
- ID
- ZDB-FIG-120126-20
- Publication
- Dong et al., 2011 - Heritable Targeted Inactivation of Myostatin Gene in Yellow Catfish (Pelteobagrus fulvidraco) Using Engineered Zinc Finger Nucleases
- Other Figures
- All Figure Page
- Back to All Figure Page
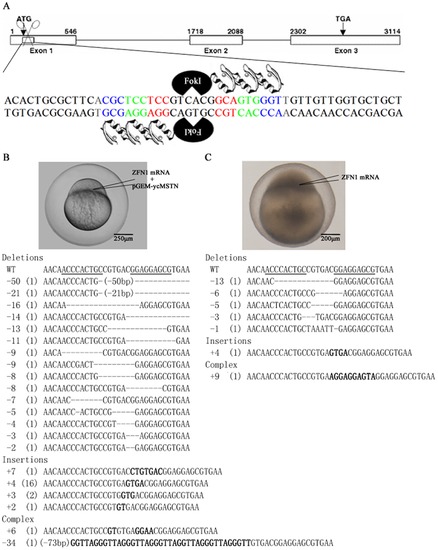
Zebrafish embryos can be used as an in vivo system to examine ZFN activity of editing yellow catfish mstn gene. (A) Schematic diagram shows ZFN1 binding to the yellow catfish mstn gene. Yellow catfish mstn exons are shown as boxes and its introns are shown as solid lines. Start codon (ATG) and stop codon (TGA) are marked in exon 1 and exon 3, respectively. Number above the exon box denotes the position of nucleotides in the gene [4]. The ZFN1 binding site is in exon 1. The triplets of nucleotides recognized by ZFN1 fingers are marked in different colors. (B) Zebrafish embryos were used as an in vivo system to examine ZFN activity of editing yellow catfish mstn gene. The plasmid containing exon 1 of yellow catfish mstn gene (pGEM-ycMSTN) was co-microinjected with ZFN1 mRNA into zebrafish embryos at 1–2-cell stage. The mstn molecules were amplified from the zebrafish embryos at 24 hpf and then subcloned for sequencing. Analyses on sequences of the molecules revealed that the molecules of disrupted mstn were categorized into three groups including deletions, insertions and complex. (C) ZFN1 cut mstn in yellow catfish genome. ZFN1 mRNA was microinjected into yellow catfish embryos at 1–2-cell stage. The mstn molecules were amplified from the yellow catfish embryos at 72 hpf and then subcloned for sequencing. Analyses on sequences of the molecules revealed that the molecules of disrupted mstn in yellow catfish genome were categorized into three groups including deletions, insertion and complex. WT: partial sequence of wild type mstn containing ZFN1 targeting site (B, C). Number in the leftmost of the panels (B, C) shows the number of nucleotides was deleted (-) or inserted (+) in the mutated mstn gene. Number in the bracket shows the frequency of the mutated molecules (B, C). Inserted nucleotides are bolded (B, C). |