
Fig. 4
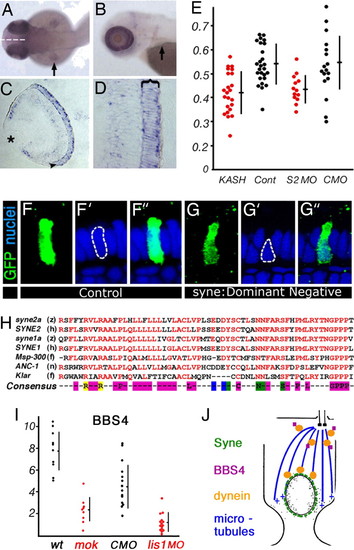
The function of syne2a in nuclear positioning. (A and B) Dorsal (A) and lateral (B) views of PTU-treated zebrafish embryos at 50 and 72 hpf, respectively. Arrows indicate the pectoral fin. syne2a expression is strongly elevated in the eye. (C and D) Transverse sections through the zebrafish retina showing syne2a transcript expression detected by in situ hybridization. The photoreceptor cell layer is indicated with an arrowhead in C and with a bracket in D. (E) The distribution of nuclear positions in cells expressing dominant negative syne2a vector (KASH, red dots) or a control empty vector (Cont, black dots) (left side of the graph) and cells treated with an anti-syne2a morpholino (S2, red dots) or a control morpholino (CMO, black dots) (right side of the graph). The positions of nuclei are calculated as defined in Fig. 1. (F–F3 and G–G3) Examples of data used to plot the distribution of nuclear positions in E in cells overexpressing a control vector (F) or a dominant negative syne2a (G). (F and G) GFP staining of cells in which nuclear positioning was evaluated. (F2 and G2) Nuclear staining (ToPro-3). (F3 and G3) Superimposed images; apical is up. (H) The alignment of KASH domains from two zebrafish syne genes to human sequences, and to sequences of invertebrate genes: Msp-300, ANC-1, and Klarsicht. Conserved residues are in red. The consensus sequence is color-coded as follows: magenta, nonpolar amino acids; blue, acidic; green, polar; yellow, basic. Species designations are as follows: z, zebrafish; h, human; f, fly; n, nematode. (I) The ratio of BBS4-positive particles to the number of cell somata in wild-type and mok photoreceptors (right side of the graph). The ratio of BBS4-positive particles to the number of basal bodies in lis1a morphants, and in control morpholino (CMO)-treated animals (left side of the graph). Each dot represents a separate retina. (J) A model of the mechanism that positions nuclei in vertebrate photoreceptors. The interaction of dynein with Syne polypeptide is hypothetical. |
| Gene: | |
|---|---|
| Fish: | |
| Anatomical Terms: | |
| Stage Range: | Long-pec to Protruding-mouth |