
Fig. 2
- ID
- ZDB-FIG-111202-13
- Publication
- Kizil et al., 2011 - Cerebroventricular Microinjection (CVMI) into Adult Zebrafish Brain Is an Efficient Misexpression Method for Forebrain Ventricular Cells
- Other Figures
- All Figure Page
- Back to All Figure Page
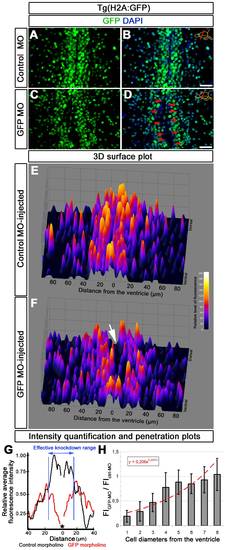
Analysis of morpholino penetration and efficient knockdown range. (A) GFP immunohistochemistry (IHC) on control morpholino-injected (Ctrl-MO) brain sections. (B) DAPI colocalization of A. (C) GFP immunohistochemistry (IHC) on GFP antisense morpholino-injected (GFP-MO) brain sections. (D) DAPI colocalization of C. Red arrows exemplify fully knocked-down cells. (E) 3D surface plot of A. x-axis: distance from the ventricle; y-axis: ventral to dorsal orientation; z-axis: relative level of fluorescence intensity. (F) 3D surface plot of C. x-axis: distance from the ventricle; y-axis: ventral to dorsal orientation; z-axis: relative level of fluorescence intensity. White arrow shows the gap, which indicates the knocked down cells. (G) Intensity quantification plot depicting relative fluorescence intensity versus distance from the ventricle in Ctrl-MO (black lines) and GFP-MO (red lines) injections. Black asterisk indicates the ventricle. Blue bars delineate the borders where GFP-MO injection leads to overt reduction in GFP fluorescence intensity. (H) Penetration prediction graph. The ratio of fluorescence intensity values between Ctrl-MO (FICtrl-MO) and GFP-MO (FIGFP-MO) versus cell diameters away from the ventricle is sketched. The trendline indicates the extent of knockdown in relation to cell diameters. Scale bars 20 μm. |