
Fig. 2
- ID
- ZDB-FIG-111128-44
- Publication
- Almeida et al., 2011 - Individual axons regulate the myelinating potential of single oligodendrocytes in vivo
- Other Figures
- All Figure Page
- Back to All Figure Page
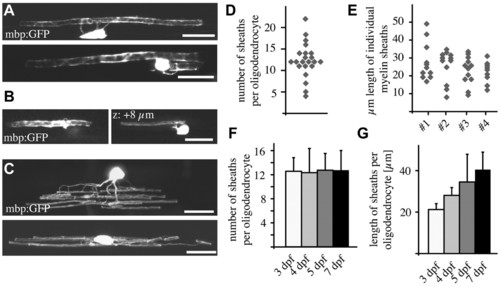
Single-cell analysis reveals morphological diversity of individual CNS oligodendrocytes. (A) Lateral views of single mbp:EGFP-expressing oligodendrocytes associating with one Mauthner axon (top) and both Mauthner axons (bottom). (B) Lateral view of a single mbp:EGFP-expressing oligodendrocyte associating with the large Mauthner axon (left) and an axon of much smaller caliber (right). (C) Lateral views of single oligodendrocytes associating with multiple axons in the dorsal spinal cord (top) and ventral spinal cord (bottom). (D) Myelin sheath number per oligodendrocyte (excluding those that myelinate the Mauthner axons) at 4 dpf. (E) Myelin sheath length in four sample oligodendrocytes (that do not associate with the Mauthner axon) at 4 dpf. (F) Average myelin sheath number per cell over time. This does not include oligodendrocytes that myelinate the Mauthner axon. (G) Average myelin sheath length per cell over time. This does not include oligodendrocytes that myelinate the Mauthner axon. Error bars represent s.d. Scale bars: 10 μm. |