
Fig. 5
- ID
- ZDB-FIG-110929-42
- Publication
- Hirose et al., 2011 - Expression patterns of lgr4 and lgr6 during zebrafish development
- Other Figures
- All Figure Page
- Back to All Figure Page
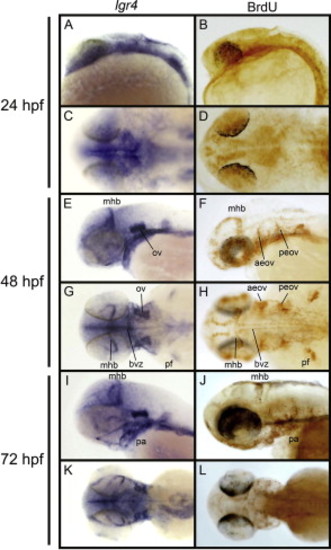
Comparison between the lgr4-expressing domains and the BrdU-incorporating proliferative zones. (A, C, E, G, I, and K) Whole-mount embryos and larvae at the indicated stages hybridized with an antisense lgr4 riboprobe. (B, D, F, H, J, and L) BrdU labeling of developing embryos and larvae at the indicated stages. (A, B, E, F, I, and J) Lateral views; (C, D, G, H, K, and L) dorsal views. For all images, anterior to the left. Many of the lgr4-expressing domains are similar to the BrdU-incorporating proliferative zones from 24 to 72 hpf. aeov, anterior end of otic vesicles; bvz, brain ventricular zone; mhb, midbrain–hindbrain boundary; ov, otic vesicles; pa, pharyngeal arches; peov, posterior end of otic vesicles; pf, pectoral fin buds. |
Reprinted from Gene expression patterns : GEP, 11(7), Hirose, K., Shimoda, N., and Kikuchi, Y., Expression patterns of lgr4 and lgr6 during zebrafish development, 378-83, Copyright (2011) with permission from Elsevier. Full text @ Gene Expr. Patterns