
Fig. 2
- ID
- ZDB-FIG-110811-34
- Publication
- Andersen et al., 2011 - In vivo imaging of cell behaviors and F-actin reveals LIM-HD transcription factor regulation of peripheral versus central sensory axon development
- Other Figures
- All Figure Page
- Back to All Figure Page
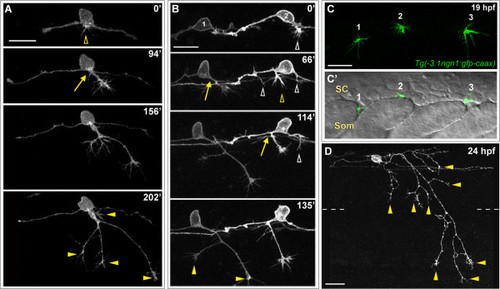
Peripheral axon development in RB neurons. (A,B,D) Individual RB neurons labeled by transient mosaic expression of TagRFP-CAAX (A,D) or GFP-CAAX (B) in wild-type embryos. Dorsal-lateral views, anterior is left. Images are confocal projections. (A) Time-lapse of RB peripheral axon outgrowth from the cell body. Several filopodial protrusions occur in the cell body region during peripheral initiation (yellow open arrowhead). The peripheral axon forms off the cell body (yellow arrow), exits the spinal cord (SC) and grows in a ventral direction while branching (yellow arrowheads indicate branch tips) in the epidermis. (B) Time-lapse of two RB neurons (1 and 2) showing peripheral axon emergence as central axon branches. RB1: a peripheral axon initiates off the descending central axon (yellow arrow), and grows ventrally while extending branches (yellow arrowheads). RB2: multiple neurites initiate as branches off both ascending and descending central axons (open arrowheads); however, only one becomes an established peripheral axon (yellow open arrowhead and arrow), and the others retract (white open arrowheads). See Additional file 2 for movie. Time displayed in minutes (A,B). (C,C′) Lateral views of a 19-hpf transgenic Tg(-3.1ngn1:gfp-caax) embryo showing the anterior-posterior position where peripheral axons exit the SC. (C) Confocal projection (green channel) of four 1-μm Z-planes showing newly formed peripheral growth cones of three RB neurons (1, 2, and 3). (C′) Single XY plane (green and DIC channel overlay) reveals sites of peripheral axon emergence. Growth cones 1 and 3 extend between somites (Som). Growth cone 2 grows over the somite. (D) Example of mature RB neuron morphology in a 24-hpf wild-type embryo. RB has an elaborated peripheral axon with many branches (some indicated with yellow arrowheads). Dashed lines indicate the position of the horizontal myoseptum. Scale bars = 25 μm. |