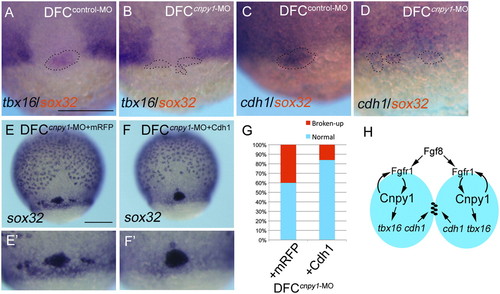
cdh1 expression. (A and B) cdh1 (purple) and sox32 (red) expression in DFCcontrol-MO (A) or DFCcnpy1-MO (B) embryos at 65% epiboly stage. (C and D) tbx16 (purple) and sox32 (red) expression in DFCcontrol-MO (C) or DFCcnpy1-MO (D) embryos at 65% epiboly stage. Dotted lines in A–D mark the outlines of DFC populations. (Scale bar: 200 μm.) (E and F) Expression of sox32 in DFCcnpy1-MO+mRFP (E) or DFCcnpy1-MO + Cdh1 (F) embryos at 80% epiboly. (Scale bar: 200 μm.) (G) Percentage of broken-up DFC phenotype in mRFP-overexpressing (n = 82) or Cdh1-overexpressing (n = 103) DFCcnpy1-MO embryos. Overexpression of Cdh1 rescued the broken-up DFC phenotype in DFCcnpy1-MO embryos (60%; P < 0.05). (H) Diagram illustrating the FGF-dependent cell–cell communication control mechanisms of the forerunner cell cluster during early development. The model depicts the activation of intracellular FGF signaling via binding of Fgf8 ligands and Fgfr1 on the cell surface of two adjacent DFCs (blue ovals). The amplified FGF signal, through Cnpy1-mediated maturation of Fgfr1 within DFCs, subsequently activates the expression of tbx16 and cdh1 to organize forerunner cells as a cluster.
|
