FIGURE

Fig. 2

ID
ZDB-FIG-110527-37
Publication
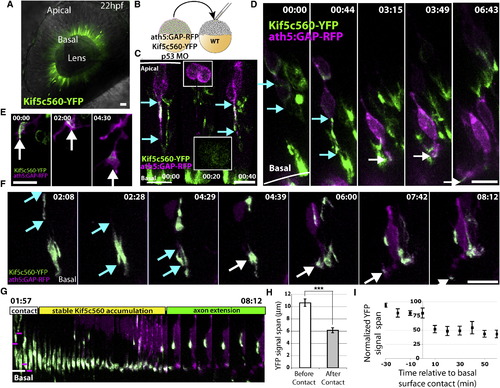
Randlett et al., 2011 - The oriented emergence of axons from retinal ganglion cells is directed by laminin contact in vivo
Other Figures
All Figure Page
Back to All Figure Page
Fig. 2

Kif5c560-YFP Marks the Axon in RGCs In Vivo, and Accumulates in a Highly Directed Manner at the Tip of the Basal Process Prior to Axon Extension

(A) Injection of Kif5c560-YFP mRNA at the one-cell stage results in expression in all retinal cells, and demonstrates that Kif5c560 accumulates basally in neuroepithelial cells. Image is a single confocal slice.

(B) Transplantation scheme used to create mosaic embryos expressing ath5:GAP-RFP and Kif5c560-YFP in a subset of RGCs.

(C) Kif5c560-YFP signal accumulation (marked by cyan arrows) is confined to the basal process of ath5-expressing neuroepithelial cells (t = 0:00) and to young postmitotic neuroblasts (t = 0:40), but is diffuse during mitosis (t = 0:20, inset).

(D) In very young RGCs with low ath5:GAP-RFP signal, Kif5c560-YFP signal is seen in the cell body (t = 0:00, YFP span marked by cyan arrows), but quickly moves to the basal process (t = 0:44), to the tip of the basal process (t = 3:15, white arrows), and finally to the extending axonal growth cone (t = 6:43).

(E) A higher-magnification example showing an RGC growth cone (arrows) navigating within the retina and demonstrating strong and specific Kif5c560-YFP accumulation.

(F) Time-lapse image demonstrating that Kif5c560-YFP signal initially spans a large portion of the basal process (span marked by cyan arrows), but upon contact with the basal surface, YFP signal accumulates specifically at the tip of the basal process (white arrows), and finally in the extending axon.

(G) Kymograph of the cell shown in (F), demonstrating that immediately after the RGC basal process (marked by magenta line) contacts the basal surface of the retina (white line), the Kif5c560-YFP signal accumulates specifically at the tip of the basal process before the axon extends.

(H) Measuring the length of Kif5c560-YFP signal span demonstrates a significant decrease in length after basal surface contact (mean ± SEM, p < 0.0001, Mann-Whitney test, n = 7 cells from three embryos).

(I) Plotting the YFP signal span normalized to the longest observed length for each cell (mean ± SEM) demonstrates that the specific accumulation of YFP occurs immediately after basal surface contact (t = 0).

Frames are taken from Movie S2. Time is shown in hr:min; scale bars = 10 μM.

Expression Data

Expression Detail
Antibody Labeling
Phenotype Data

Phenotype Detail
Acknowledgments
This image is the copyrighted work of the attributed author or publisher, and ZFIN has permission only to display this image to its users. Additional permissions should be obtained from the applicable author or publisher of the image. Full text @ Neuron