
Fig. 5
- ID
- ZDB-FIG-110407-40
- Publication
- Carvalho et al., 2011 - A high-throughput screen for tuberculosis progression
- Other Figures
- All Figure Page
- Back to All Figure Page
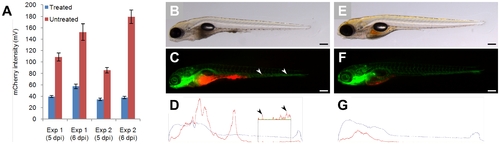
Automatic yolk sac injection of M. marinum and effect of treatment on infected larvae. (A) Effect of treatment on bacterial growth (measured by COPAS) in 5 and 6 day-old fli1-egfp larvae with gfp-labelled vasculature. Blue bars represent treated embryos, red bars represent untreated embryos. (B–D) Untreated versus (E–G) treated 5 day-old larvae, depicted whole in (B and E) bright-field and (C and F) fluorescent images, and (D and G) profiled by COPAS (scale bar: 250 μm). The localization of bacteria (red) in C and F correlates well with COPAS profile peaks in D and G, respectively (peaks in the tail region are shown enlarged in the inset; arrowheads depict two representative locations). |