
Fig. 1
- ID
- ZDB-FIG-110317-46
- Publication
- Ludwig et al., 2011 - Whole-Body Analysis of a Viral Infection: Vascular Endothelium is a Primary Target of Infectious Hematopoietic Necrosis Virus in Zebrafish Larvae
- Other Figures
- All Figure Page
- Back to All Figure Page
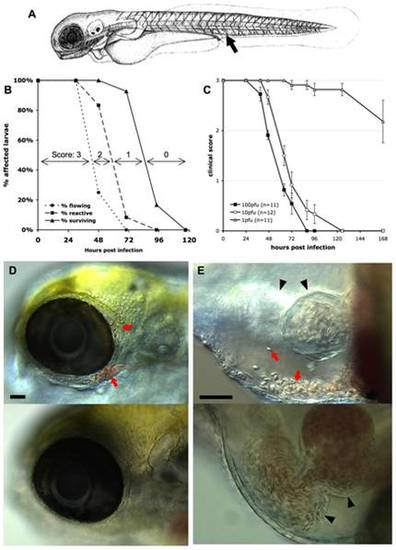
Macroscopic signs of IHNV infection. A. drawing of a 72 hpf larva (length, ~3 mm) showing the site of inoculation (arrow). B: Onset of disease signs in IHNV-infected larvae. 12 larvae were inoculated at 72 hpf by iv microinjection of ~100 pfu IHNV25 and incubated individually at 24°C. At regular intervals, they were scored under the dissecting scope for possession or loss of three properties, each shown on a separate curve: active blood flow (circles), reactivity to touch (squares), or survival (triangles). All control uninfected larvae (n = 6) remained reactive with strong blood flow during the whole time interval. Experiment repeated three times with comparable results. C. Effect of the dose of injected virus on disease course, using a clinical scoring method. Larvae (77 hpf) were injected with varying doses of IHNV25, incubated individually at 24°C, and regularly checked for survival, blood flow in the tail, and reactivity to touch, to attribute a clinical score to each individual (criteria illustrated on panel B; see >Methods for details). Graph displays mean clinical score for each group; error bars correspond to standard error of the mean (s.e.m). Experiment repeated twice with similar outcome. D and E: Accumulation of erythrocytes in larvae 40 hours after injection of IHNV25. Lateral views, anterior to the left, dorsal to the top; live DIC imaging. Top panel: IHNV-infected larva; bottom panel, uninfected control. C (10x objective) head with erythrocytes accumulated around the eye (arrows). D (20x objective) pericardial cavity. Arrows, erythrocytes. Arrowheads, heart (left arrowhead: ventricle, right arrowhead, atrium. Because different focal planes have been selected to provide the best view of the pericardial cavity, the ventricle is out of focus for the infected larva). Scale bars, 50 μm. |