
Fig. 2
- ID
- ZDB-FIG-110317-40
- Publication
- Wang et al., 2011 - Stage-Specific Expression of TNFα Regulates Bad/Bid-Mediated Apoptosis and RIP1/ROS-Mediated Secondary Necrosis in Birnavirus-Infected Fish Cells
- Other Figures
- All Figure Page
- Back to All Figure Page
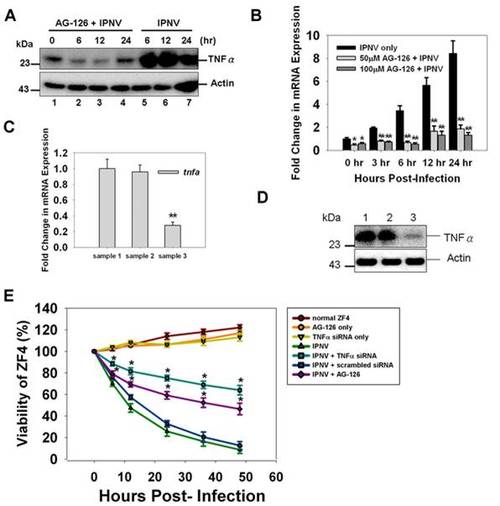
(A) TNFα protein expression level in IPNV-infected ZF4 cells (MOI = 1) 0, 6, 12, and 24 h p.i. The protein was detected using western blot with a polyclonal antibody specific for TNFα. Lanes 1–4: ZF4 cells were pretreated with 50 μM AG-126 and infected with IPNV for 0 (lane 1), 6 (lane 2), 12 (lane 3), or 24 (lane 4). Lanes 5–7: Untreated ZF4 cells were infected with IPNV for 6 (lane 5), 12 (lane 6), or 24 h (lane 7). The expression of actin was used as an internal control. (B) TNFα mRNA expression in IPNV-infected ZF4 cells was quantified using RT-PCR. The ZF4 cells were pre-treated with 50 μM or 100 μM AG-126 for 2 hours, infected with IPNV (MOI = 1), and incubated for 0, 3, 6, 12, or 24 h. The expression of ef1a (elongation factor 1-alpha) was used as an internal control. (C) The tnfa expression was inhibited by TNFα-specific siRNA in IPNV-infected cells. TNFα expression was efficiently inhibited by TNFα-specific siRNA after IPNV infection. Sample 1: ZF4 cells infected by IPNV. Sample 2: ZF4 cells pretreated with scrambled siRNA and then infected by IPNV. Sample 3: ZF4 cells pretreated with TNFα-specific siRNA and then infected by IPNV. The quantification of gene expression in normal versus siRNA-treated cells was calculated relative to ef1a. (D) Detection of TNFα in untreated or TNFα-specific siRNA-treated ZF4 cells after IPNV infection by western blotting. Lane 1: untreated ZF4 cells; lane 2: ZF4 cells treated with control siRNA; lane 3: ZF4 cells treated with TNFα-specific siRNA. The expression of actin was used as an internal control. (E) Cell viability of IPNV-infected ZF4 cells pre-treated with TNFα-specific siRNA or AG-126 at 0, 6, 12, 24, 36 and 48 h p.i. The viability of each sample was determined in three individual experiments. Data shown are the mean ± SD. Student′s t tests indicate significant differences compared to IPNV infection only or untreated control: *, p<0.05; **, p<0.01. |