
Fig. S1
- ID
- ZDB-FIG-110214-62
- Publication
- Maurya et al., 2011 - Integration of Hedgehog and BMP signalling by the engrailed2a gene in the zebrafish myotome
- Other Figures
- All Figure Page
- Back to All Figure Page
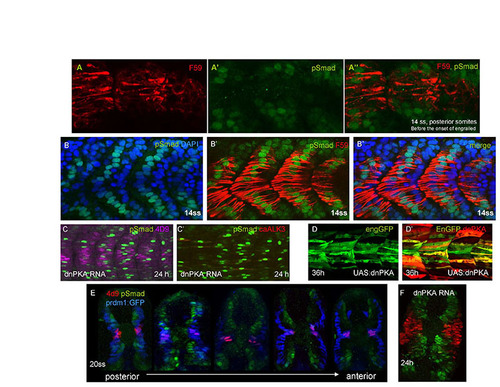
Spatio-temporal distribution of pSmad in wild-type and manipulated embryos. (A-A″) Parasagittal optical sections of posterior somites in a 14 ss zebrafish embryo, showing pSmad marks the most dorsal and ventral adaxial cell nuclei, before their stacking and onset of Engrailed. (B-B″) Parasagittal optical section of a 14 ss embryo labelled with pSmad, mAb F59 (slow fibres) and DAPI, showing a lack of pSmad in slow fibre nuclei close to the notochord. The same section is shown as in Fig. 2A. (C,C′) Parasagittal optical section of a 24 hour embryo injected with dnPKA RNA and UAS:caALK3-UAS:tRFP showing complimentary pattern of 4d9 (purple) and pSmad (green); high levels of pSmad are induced in the cells expressing tRFP (red). (D,D′) Parasagittal optical sections of a 24 hour actin:GAL4 embryo injected with UAS:dnPKA-UAS:tRFP (red) showing cell-autonomous induction of eng2a:eGFP by dnPKA-expressing clones. (E) Cross-sections from a 20 ss embryo along different anteroposterior levels, marked with pSmad, mAb 4D9 and prdm1:GFP (slow muscle, blue). Younger/posterior somites display pSmad marking slow fibres, whereas in older/anterior somites pSmad marks a medial population of fast fibre muscle nuclei. (F) Cross-section of a 24 hour embryo injected with dnPKA RNA and marked wih pSmad and mAb 4D9. |