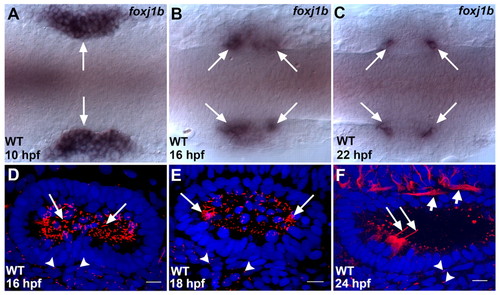
Expression of foxj1b and the distribution of cilia in the zebrafish otic vesicle. (A) In the wild type (WT), foxj1b is initially expressed throughout the otic placodes (arrows). (B) Restriction of foxj1b expression to the two poles of the otic placodes (arrows) at 16 hpf. (C) foxj1b expression finally gets restricted to a small cluster of cells at the anterior and posterior ends of the otic vesicles (arrows). (D) Large numbers of cilia (arrows) initially populate the otic vesicle. (E) Subsequently, most of the cilia disappear, except at the two poles (arrows). (F) At 24 hpf, hair cell kinocilia are clearly visible at the two poles (long arrows), whereas cilia in the rest of the vesicle have regressed. The ears of embryos shown in A-C are labeled with foxj1b antisense RNA probe, whereas those in D-F are labeled with anti-acetylated tubulin antibodies (ciliary axonemes, red) and with DAPI (nuclei, blue). In D-F, primary cilia in cells adjoining the otic vesicles are indicated (arrowheads). In F, the short arrows mark neuronal processes which are also labeled by the anti-acetylated tubulin antibodies. A-C, dorsal views; D-F, lateral views of otic vesicles. Scale bars: 10 μm.
|
