
Fig. 6
- ID
- ZDB-FIG-110207-39
- Publication
- Tehrani et al., 2011 - Antagonistic interactions of hedgehog, Bmp and retinoic acid signals control zebrafish endocrine pancreas development
- Other Figures
- All Figure Page
- Back to All Figure Page
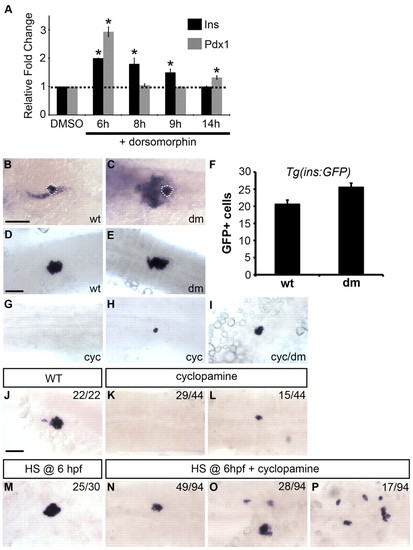
Decrease in Bmp signaling partially rescues dorsal bud-derived β-cells in Hh-deficient embryos. (A) qPCR of insulin and pdx1 expression at 24 hpf in wild-type embryos treated with dorsomorphin (15 μM) or DMSO starting at 6, 8, 9 or 14 hpf until harvest (mean ± s.e.m.). Treatment during gastrulation enhanced both pdx1 and insulin transcript levels. Asterisks indicate a significant change (at least 2 s.d.) compared with control. (B,C)The pdx1 expression domain at 24 hpf is expanded in embryos treated with dorsomorphin (dm) starting at early gastrulation (6 hpf) (C) as compared with untreated embryos (B). White dotted lines outline the dorsal pancreas. (D,E,G-I) insulin expression at 24 hpf in wild-type embryos treated with ethanol plus DMSO (D), dorsomorphin (E), cyclopamine (cyc) (G,H) and cyclopamine plus dorsomorphin (I). Treatment with dorsomorphin began at ∼6-7 hpf until harvest. (F) Quantification of Tg(ins:GFP)-expressing cells in 24-hpf embryos treated with dorsomorphin starting at 6 hpf. (J-P) Embryos obtained from outcrosses of hemizygous Tg(hsp70l:dnBmpr-GFP)w30 adult zebrafish were incubated in cyclopamine, heat shocked (HS) at 6 hpf, and examined for insulin expression at 24 hpf. In cyclopamine-treated control embryos, insulin expression was either absent (K) or severely reduced (L) as compared with wild type (J). In heat shocked Tg(hsp70l:dnBmpr-GFP)w30 embryos, insulin expression and islet size were increased (M). When Bmp activity was reduced by heat shock at 6 hpf in cyclopamine-treated embryos, insulin expression was partially rescued (N-P). Based on islet size and morphology, embryos were scored into three phenotypic classes: small cluster (N), medium cluster (O) or scattered (P). Cyclopamine (25 μM) treatments started at 2 hpf until harvest. The number of embryos displaying similar expression patterns is indicated in each case. All images are dorsal views, anterior to the left. Scale bars: 100 μm in B; 50 μm in D. |