|
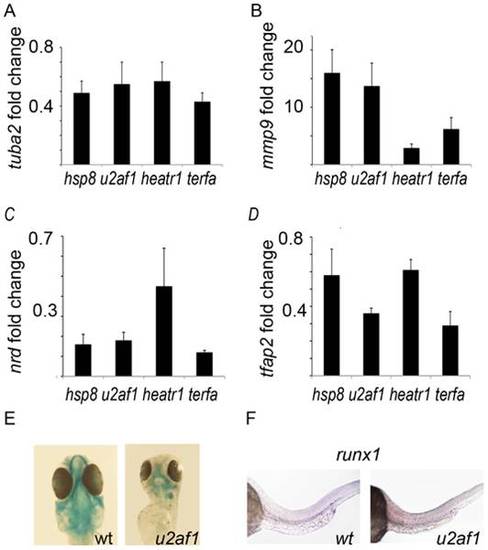
In mutants, biosynthesis was generally suppressed and catabolism was activated.> A) Expression of structural proteins was downregulated; tuba2 is shown as an example. B) Expression of catabolizing enzymes was upregulated; mmp9 is shown as an example. C) Expression of neural genes was especially strongly suppressed in mutants; nrd is an example of a downregulated neural gene. D) Expression of a neural crest cell marker tfap2 was downregulated. E) Only rudiments of the head skeleton derived from neural crest cells were present in the mutants. Alcian blue. Day 4. F) Upregulation of p53 affects blood development; HSC marker runx1 was downregulated in the mutants; u2af1 mutant is shown as an example.
|