
FIGURE
Fig. 4
- ID
- ZDB-FIG-101208-9
- Publication
- Gamba et al., 2010 - Lef1 controls patterning and proliferation in the posterior lateral line system of zebrafish
- Other Figures
- All Figure Page
- Back to All Figure Page
Fig. 4
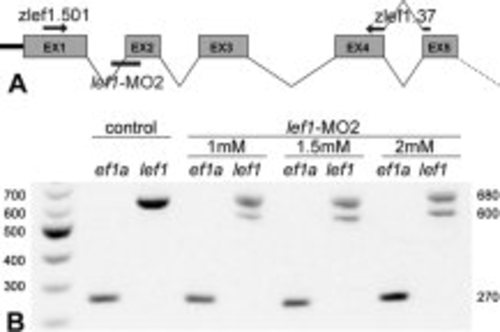
Quantification of lef1-MO2 efficiency. A: Topology of lef1 gene structure indicating the positions of the morpholino target, in green, and the primers used for quantification, in red. The gene comprises 10 exons. B: Distribution of normally spliced (680 bp) and of morphant (600 bp) mRNA in different morphant conditions. MO, morpholino oligonucleotide. |
Expression Data
Expression Detail
Antibody Labeling
Phenotype Data
Phenotype Detail
Acknowledgments
This image is the copyrighted work of the attributed author or publisher, and
ZFIN has permission only to display this image to its users.
Additional permissions should be obtained from the applicable author or publisher of the image.
Full text @ Dev. Dyn.