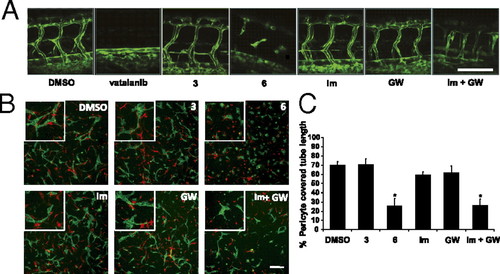
Combination of imatinib and GW 5074 inhibits angiogenesis similarly to compound 6. (A) Effect of 3, 6, vatalanib, imatinib, GW 5074, and a combination of imatinib (PDGFR inhibitor) and GW 5074 (RAF inhibitor) on intersegmental vessel formation in Tg:(fli1-egfp) zebrafish embryos. Embryos were treated with DMSO, 5 μM 3, 5 μM 6, 1 μM vatalanib, 5 μM imatinib (Im), 1 μM GW 5074 (GW), and the combination of 5 μM imatinib and 1 μM GW 5074 (Im + GW) from 16 until 48 hpf. Z stacks from laser-scanning confocal microscopy are shown depicting formation of the intersegmental vessels at 48 hpf. n = 6 embryos/treatment. (Scale bar, 100 μm.) (B) HUVECs were cocultured with hTERT-human hepatic stellate cells in a 3D collagen matrix in the presence of complete EBM-2 medium to monitor pericyte-associated endothelial tube formation. The stellate cells were labeled with 10 μg/mL red fluorescent dye [DiIC(3); BD Biosciences] for 1 h before the start of the experiment. Inhibitors were added to the cocultures 6 h postseeding at the following concentrations: DMSO, 2.5 μM 3, 2.5 μM 6, 1 μM imatinib (Im), 0.5 μM GW 5074 (GW), and the combination of 1 μM imatinib and 0.5 μM GW 5074 (Im + GW). The endothelial tubes were stained at 24 h by adding 2 μL FITC-labeled Ulex europaeus lectin (Vector Labs) per well. Images were acquired 48 h postseeding of the cells. One representative panel from three independent experiments is shown. Green, FITC-lectin-labeled endothelial cells; red, DiIC(3)-labeled stellate cells. Inset in each panel displays a higher-magnification view of the endothelial cell/stellate cell interactions. (Scale bar, 200 μm.) (C) Tube lengths were measured using MetaMorph software for each tube for all 10 fields that were acquired. The % pericyte-covered tube length was calculated from the ratio of tube length sums for the tubes with and without pericyte contact. Error bars are reported as ± SEM of two wells per group. *P < 0.05 compared to DMSO group.
|
