
Fig. S4
- ID
- ZDB-FIG-101119-28
- Publication
- Brown et al., 2009 - Expression profiling during ocular development identifies 2 Nlz genes with a critical role in optic fissure closure
- Other Figures
- All Figure Page
- Back to All Figure Page
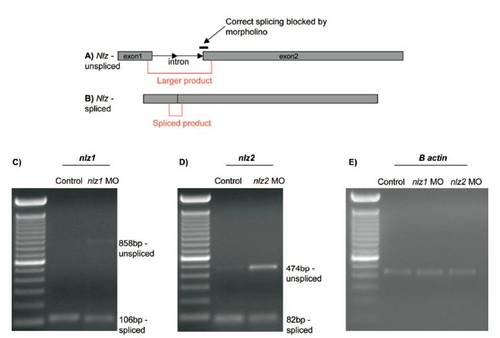
RT-PCR confirms correct targeting of splice site blocking morpholinos and knockdown of target transcript at 24 hpf. Diagram depicting the target site of nlz1 and nlz2 splice blocking morpholinos at the intron 1–exon 2 boundary and PCR primer positions (red) spanning the intron in unspliced (A) and spliced (B) transcripts. (C) Agarose gel showing reduction of smaller spliced nlz1 product (106 bp) and appearance of unspliced product (858 bp) in embryos injected with nlz1 MO.(D) Agarose gel showing reduction of smaller spliced nlz2 product (82 bp) and appearance of more robust unspliced product (474 bp) in embryos injected with nlz2 MO. (E) Actin control RT-PCR in control, nlz1, and nlz2 MO injected embryos. |