
Fig. S1
- ID
- ZDB-FIG-101117-36
- Publication
- Koide et al., 2009 - Olfactory neural circuitry for attraction to amino acids revealed by transposon-mediated gene trap approach in zebrafish
- Other Figures
- All Figure Page
- Back to All Figure Page
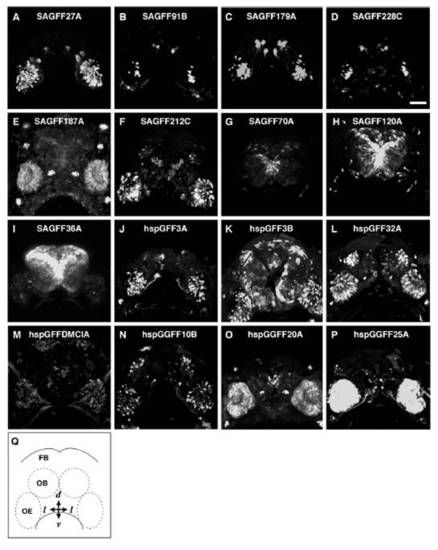
Various patterns of GFP expression in the gene trap (A–I) and enhancer trap (J–P) zebrafish lines. Frontal views of 5-day-old larvae with ventral to the bottom. SAGFF27A (A), SAGFF91B (B), SAGFF179A (C), and SAGFF228C (D): distinct subsets of OSNs (see Results for details). (E) SAGFF187A: nonneuronal cells in the OE and neuromasts. (F) SAGFF212C: a subset of OSNs and cells in the forebrain. SAGFF70A (G), SAGFF120A (H), and SAGFF36A (I): cells in forebrain and small subsets of OSNs. (J) hspGFF3A: a subset of OSNs. (K) hspGFF3B: OSNs and epidermis. hspGFF32A (L), hspGFFDMCIA (M), and hspGGFF10B (N): OSNs and forebrain neurons. hspGGFF20A (O) and hspGGFF25A (P): nonneuronal cells in the OE and cells in the forebrain. (Q) A schematic diagram illustrating the frontal view of zebrafish larva. FB, forebrain; OB, olfactory bulb; OE, olfactory epithelium. (Scale bar: 50 μm.) |