|
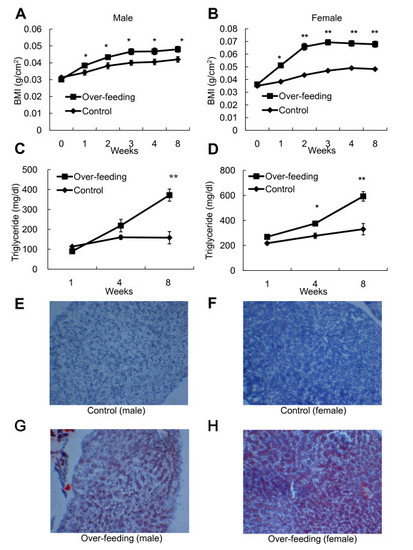
Assessment of BMI, plasma TG and hepatic steatosis in zebrafish overfed with Artemia. Changes in BMI (g/cm2) in male (A) and female (B) zebrafish in the control and OF groups. Values are means ± SEM. OF group: n = 17 males and 16 females. Control group: n = 14 males and 17 females. Changes in plasma TG levels in male (C) and female (D) zebrafish in the control and OF groups. Values are means ± SEM. OF group: n = 7 males and 8 females. Control group: n = 7 males and 9 females. Statistical analyses were performed using Student′s t-test to compare the OF and control groups at each time-point. *P < 0.05, **P < 0.01. (E-H) Oil Red O staining of liver sections from a male (E) and female (F) in the control group and a male (G) and female (H) in the OF group.
|