|
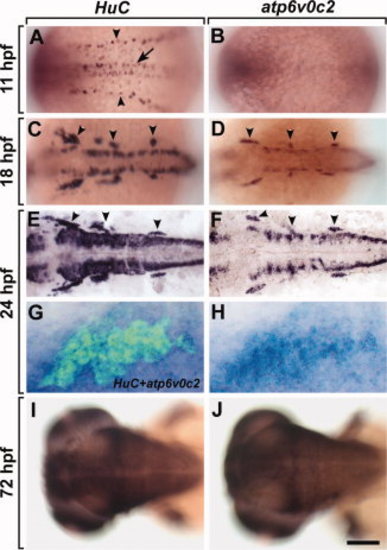
Spatial and temporal expression patterns of atp6v0c2 and HuC analyzed by in situ RNA hybridization. A–J: Dorsal views, anterior to the left, of whole embryos. A: Expression of HuC in primary motor neurons (arrow) and Rohon-Beard cells (arrowheads). B: There is no detectable expression of atp6v0c2 in 3-somite stage (11-hpf) embryos. Expression of HuC(C, E) and atp6v0c2(D, F) in 18-hpf embryos (C, D) and 24-hpf embryos (E, F). Arrowheads indicate cranial ganglions. G, H: Expression of atp6v0c2 RNA alone (H) and subsequent labeling of the same embryo with anti-Hu antibody (G) (green fluorescence) at the trigeminal ganglion of the 24 hpf embryo. I, J: Expression of HuC (I) and atp6v0c2(J) in the brain of 72-hpf embryos. Scale bar: A–F, I, J, 60 μm; G, H, 10 μm.
|