|
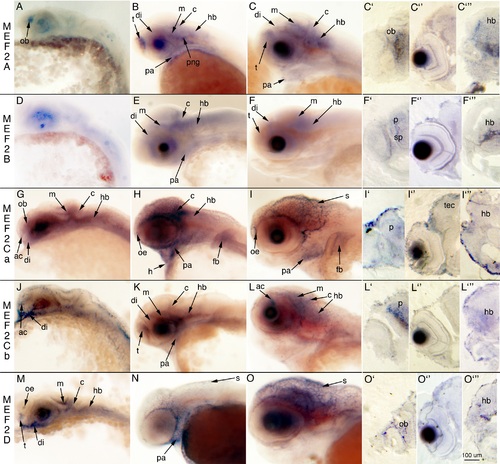
MEF2 isoforms are expressed in distinct temporal and spatial expression patterns in the developing CNS. All MEF2 isoforms are expressed in the nervous system during development as determined by whole embryo ISH. Lateral views of the head at 24 hpf (A, D, G, J, M), 48 hpf (B, E, H, K, N), and 72 hpf (C, F, I, L, O) and coronal sections of stained embryos at 48 hpf (I2–I23) and 72 hpf (C2–C23 F2–F23 L2–L23 O2–O23). ac, anterior commissure; c, cerebellum; di, diencephalon; fb, finbud; h, heart; hb, hindbrain; m, midbrain, ob, olfactory bulb; oe, olfactory epithelium; p, pallium; pa, pharyngeal arches; png, peripheral nerve ganglia; s, skin; sp, subpallium; t, telencephalon; tec, tectum. Some embryos have been manually deyolked.
|