
FIGURE
Fig. S5
Fig. S5
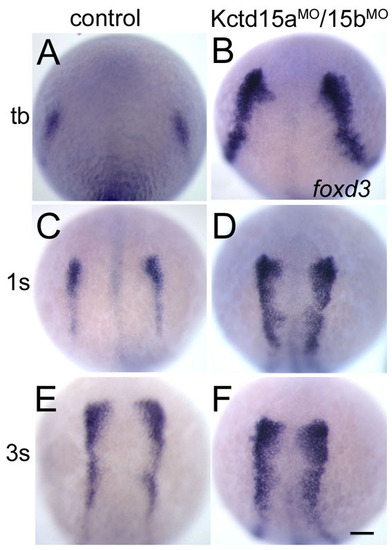
Kctd15 morphants show expansion of NC domain. (A-F) Expression of foxd3 was analyzed by in situ hybridization in control MO-injected embryos (A,C,E) and Kctd15aMO/15bMO-injected embryos (B,D,F) at different stages. Kctd15aMO/15bMO-injected embryos show expansion of foxd3 expression at the tail bud stage (B, 25/32), the 1s stage (D, 28/35) and the 3s stage (F, 40/50). Dorsal view, anterior towards the top. tb, tail bud. Scale bar: 100 μm. |
Expression Data
Expression Detail
Antibody Labeling
Phenotype Data
Phenotype Detail
Acknowledgments
This image is the copyrighted work of the attributed author or publisher, and
ZFIN has permission only to display this image to its users.
Additional permissions should be obtained from the applicable author or publisher of the image.
Full text @ Development