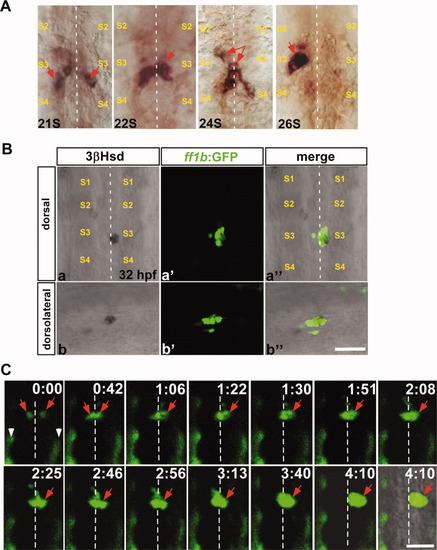
The ff1b-expressing interrenal primordia during midline fusion and lateral repositioning. A: Ventral flat mount views of 21-somite (21S), 22-somite (22S), 24-somite (24S), and 26-somite (26S) stage embryos, which were subject to ISH for detecting ff1b mRNA, with anterior oriented to the top. B: The colocalization of steroidogenic activity and ff1b:GFP transgene expression at the interrenal tissue, in the Tg(ff1bEx2:GFP) embryo. Confocal images display the steroidogenic cells as detected by 3&geta;Hsd activity staining (a,b), and the green fluorescence driven by ff1b promoter (a′,b′), in a Tg(ff1bEx2:GFP) embryo at 32 hpf. The merged images of 3 μ-Hsd activity staining and GFP are shown in a″,b′. a-a″: Dorsal views with anterior to the top; (b-b″) dorsolateral views with anterior to the right. C: Confocal time-lapse imaging of the interrenal tissue in a live Tg(ff1bEx2:GFP) embryo. A dechorionated embryo at around 21-somite stages was mounted with the dorsal side up in 3% methyl cellulose. The fluorescent images were collected at 1-min intervals, and representative frames are shown. The last frame of the time series is a merge of fluorescent and bright-field images. Time is indicated by hours:minutes. Since the sample was kept at 23°C during observation, developmental stages cannot be accurately addressed. Each fluorescent image in B and C represents a projection of a consecutive z-stack encompassing the depth of the interrenal tissue. Both ISH and time-lapse ff1b:GFP analyses show that the interrenal primordia fuse at the midline prior to the lateral relocalization. Red arrows indicate ff1b-expressing interrenal primordia in A, and the ff1b promoter-driven interrenal-specific fluorescence in C. S2, S3, and S4, the second, third, and fourth somite, respectively. White arrowheads in C indicate ectopic GFP expression in muscle pioneer cells. White dotted lines indicate the position of the midline. Scale bar = 50 μM.
|
