
Fig. S1
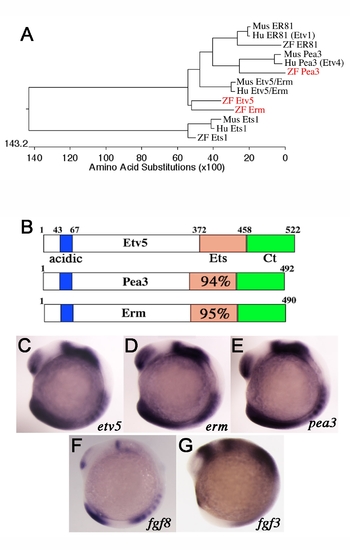
Comparative expression of Pea3 ETS transcription factors during zebrafish development. (A) Phylogenetic alignment of selected zebrafish (red), mouse and human PEA3 ETS factors. (B) Diagram of structural features of Pea3 ETS proteins showing the conserved acidic region (acidic), ETS DNA binding domain (Ets), and carboxyl region (Ct). Percent identities between Etv5 ETS domain to Pea3 and Erm are listed. (C–G) Lateral views at 10-somite stage. In situ probes indicated on the bottom right corner. Pea3 ETS transcription factors have overlapping expression patterns and are similar to that of fgf3 and fgf8 ligands. |
Reprinted from Developmental Biology, 342(1), Znosko, W.A., Yu, S., Thomas, K., Molina, G.A., Li, C., Tsang, W., Dawid, I.B., Moon, A.M., and Tsang, M., Overlapping functions of Pea3 ETS transcription factors in FGF signaling during zebrafish development, 11-25, Copyright (2010) with permission from Elsevier. Full text @ Dev. Biol.