
FIGURE
Fig. 2
- ID
- ZDB-FIG-100429-109
- Publication
- de Jong et al., 2010 - RNA isolation method for single embryo transcriptome analysis in zebrafish
- Other Figures
- All Figure Page
- Back to All Figure Page
Fig. 2
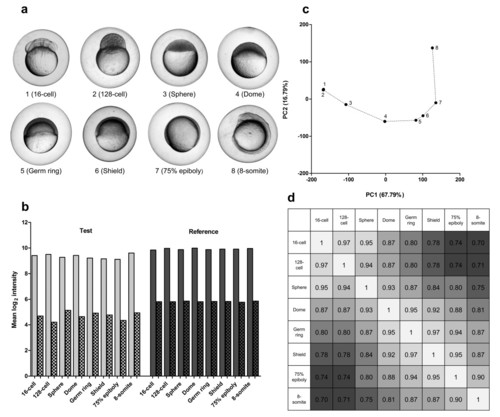
Dissecting zebrafish development with microarray analysis. (a) Eight selected embryos ranging from the 16-cell to 8-somite stage. (b) Mean, unnormalized log2 signal intensities from microarray analysis (smooth bars, foreground signal and scatter board bars, background signal). (c) Principal component analysis (PCA) on unnormalized log2 ratio data (test/reference) showing a ′developmental′ curve starting at the 16-cell stage and ending at the 8-somite stage. (d) Spearman correlations between the samples reflect the developmental distance. |
Expression Data
Expression Detail
Antibody Labeling
Phenotype Data
Phenotype Detail
Acknowledgments
This image is the copyrighted work of the attributed author or publisher, and
ZFIN has permission only to display this image to its users.
Additional permissions should be obtained from the applicable author or publisher of the image.
Open Access.
Full text @ BMC Res. Notes