
Fig. 6
- ID
- ZDB-FIG-100309-93
- Publication
- Patterson et al., 2010 - BMP regulation of myogenesis in zebrafish
- Other Figures
- All Figure Page
- Back to All Figure Page
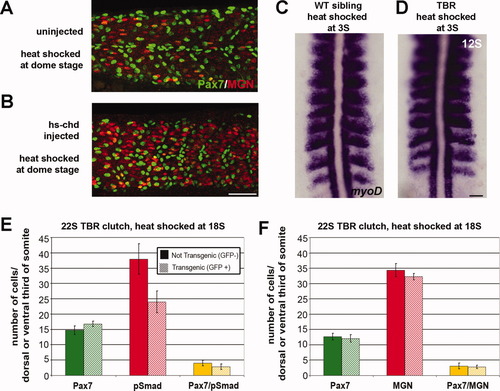
The effect of inhibition of BMP signaling on muscle differentiation. A: Expression of Myogenin (MGN, red) and Pax7 (green) at 24 hr in an uninjected embryo. B: Expression of Pax7 (green) and MGN (red) at 24 hr following heat-shock induction of Chordin at the dome stage. Somitic Pax7 expression is still apparent. C: Normal expression of myoD at 12S. D: Expression of myoD at 12S following heat-shock induction of TBR at 3S. Inhibition of BMP signaling with TBR does not change the early expression of myoD compared to WT siblings. E: Quantification of pSmad labeling in 22S embryos following heat-shock induction of TBR at 18S. The number of pSmad-expressing cells in embryos containing the transgene (red, hatched) is reduced by approximately 40% compared to the WT siblings (red, solid). There is no significant change in the number of pSmad/Pax7 double (yellow, hatched) -labeled cells, or the number of Pax7 (green, hatched) -expressing cells compared to the WT siblings (solid bars). N=5 for all groups F: Quantification of Myogenin-expressing cells at the dorsal and ventral thirds of the somite following heat shock of the TBR clutch analyzed in E. There is no significant change in the number of cells expressing Myogenin (red, hatched), Pax7 (green, hatched), or both Myogenin and Pax7 (yellow, hatched) in transgenic embryos when compared to WT siblings (solid bars). N = 5 for all groups. Scale bars = 50 μm. |