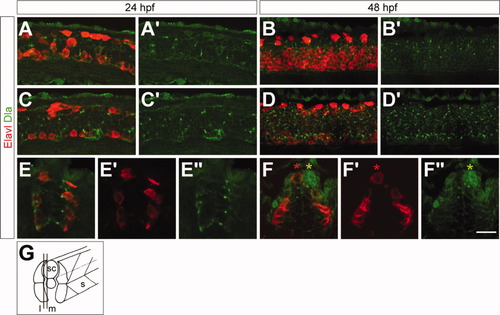
Dla and Elavl protein expression domains are nearly mutually exclusive. A-D′ show lateral views and E-F″ transverse views of the spinal cord in 24 hours postfertilization (hpf; A,A′,C,C′,E-E″) and 48 hpf (B,B′,D,D′,F-F″) embryos, stained with Elavl (red) and Dla (green) antibodies. A′,B′,C′,D′,E″,F″ show only the green channel, E′,F′ only the red channel. The relative position of the images is marked in the cartoon (G). A-B′: In more lateral regions of the spinal cord, more cells express Elavl than express Dla. C-D′: In more medial regions of the spinal cord, there are less Elavl-positive neurons than Dla-positive cells. E-E″: Transverse section showing that Dla is localized closer to the midline compared with Elavl. F-F″: Transverse section showing a case in which an RB neuron expresses Dla but not Elavl (green asterisk). An RB neuron on the opposite side of the spinal cord expresses Elavl but not Dla (red asterisk). G: Cartoon showing the level of the sections shown in the photos; (l) more lateral section as seen in A-B′ and (m) more medial sections as seen in C-D′. sc, spinal cord; s, somite. Scale bars = 20 μm in A,A′,C,C′, 25 μm in B,B′,D,D′, 10 μm in E-F″.
|
