
Fig. 5
- ID
- ZDB-FIG-091121-16
- Publication
- Söllner et al., 2009 - A cell surface interaction network of neural leucine-rich repeat receptors
- Other Figures
- All Figure Page
- Back to All Figure Page
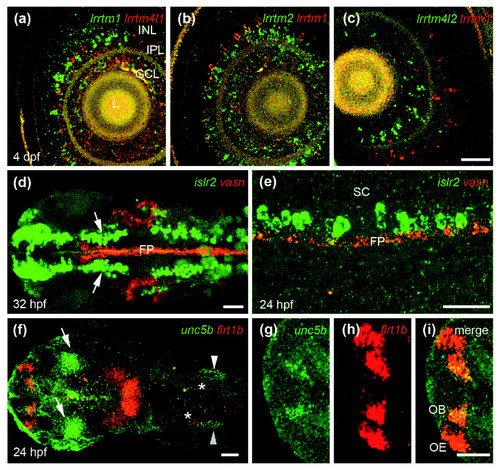
Two-color wholemount in situ hybridization of interacting neuroreceptors. (a-c) Single optical sections showing largely non-overlapping expression of the Lrrtm genes within the inner nuclear and ganglion cell layers of 4 days post-fertilization zebrafish retinae. Note that the confluent yellow staining within the lens represents background auto-fluorescence in both channels. (d-e) Neuron-glia interactions. (d) Dorsal view of the head region of a 32 hour post-fertilization (hpf) zebrafish embryo: vasn (red) is expressed in the most ventral part of the spinal cord in the medial floor plate cells (FP). islr2 (green) is expressed in fore-, mid- and hindbrain neurons; note that the midbrain neurons are in direct contact with the floor plate (arrows). (e) Lateral view of the developing spinal cord of a 24 hpf zebrafish embryo showing discrete cells within the spinal cord (SC) that are directly adjacent but dorsal to the floor plate. (f-i) Dorsal views of a 24 hpf zebrafish embryo showing expression of unc5b (green) and its interacting partner flrt1b (red). (f) unc5b is expressed in the dorsal retina (arrows) and the ear (arrowheads), flrt1b in the dorsal regions of the lateral midbrain and mid-hindbrain boundary; expression is also detectable in the vestibulo-acoustic ganglion (asterisks). (g-i) Higher magnification of the forebrain showing that unc5b is also expressed in the medial part of the olfactory bulb (g) where it overlaps with the flrt1b staining (h) in the olfactory bulb (OB) and olfactory epithelium (OE) (i). Scale bars: 50 μm (a-c); 80 μm (d); 40 μm (e); and 50 μm (f-i). GCL = retinal ganglion cell layer; INL = inner nuclear layer; IPL = inner plexiform layer; L = lens; OB = olfactory bulb; OE = olfactory epithelium. |
| Genes: | |
|---|---|
| Fish: | |
| Anatomical Terms: | |
| Stage Range: | Prim-5 to Day 4 |