
Fig. 2
- ID
- ZDB-FIG-090721-2
- Publication
- Harvey et al., 2009 - Visualisation and Quantification of Morphogen Gradient Formation in the Zebrafish
- Other Figures
- All Figure Page
- Back to All Figure Page
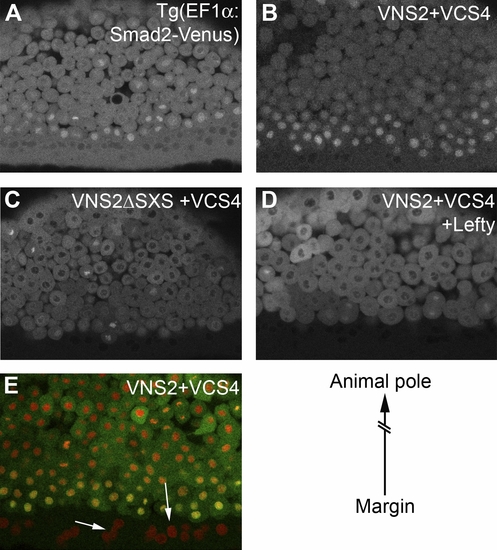
Visualisation of Endogenous Nodal Signalling Images of a Smad2-Venus transgenic embryo (A) and embryos injected with Smad2/4 BiFC constructs (B–E) are shown. Embryos are positioned such that marginal cells are at the bottom of each image, with animal pole cells towards the top (see diagram lower right). Smad2-Venus transgenic embryos (A) and embryos injected with the Smad2/4 BiFC constructs (B) display strong nuclear fluorescence in cells at the margin, while cells positioned nearer to the animal pole do not. (C) Nuclear fluorescence was not observed in the marginal cells of embryos injected with RNA encoding BiFC constructs that lack the TGF-β phosphorylation site (VNS2ΔSXS/VCS4). (D) Nuclear fluorescence in marginal cells was also abolished when embryos were co-injected with RNA encoding Smad2/4 BiFC constructs and the nodal antagonist Lefty (Antivin). (E) An embryo injected with RNA encoding Smad2/4 BiFC constructs (green) and a histone marker (red). Arrows show that nuclei in the YSL are devoid of Smad2/4 BiFC, while the most marginal nuclei show strong Smad2/4 BiFC and therefore appear yellow. |