
FIGURE
Fig. 3
- ID
- ZDB-FIG-090424-13
- Publication
- Burzynski et al., 2009 - Characterization of spatial and temporal expression pattern of SCG10 during zebrafish development
- Other Figures
- All Figure Page
- Back to All Figure Page
Fig. 3
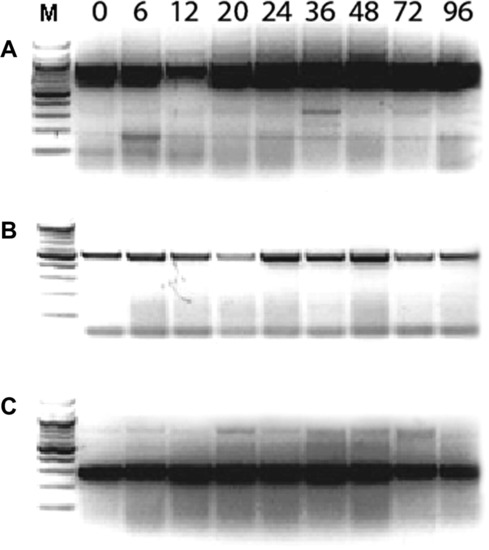
Temporal expression pattern of zebrafish SCG10a and SCG10b genes. RT-PCR was undertaken using RNA isolated from wild-type embryos at 0, 6, 12, 20, 24, 36, 48, 72, and 96 hpf; A, SCG10a; B, SCG10b; C, β-tubulin; M, 100 bp DNA ladder (New England Biolabs). |
Expression Data
| Genes: | |
|---|---|
| Fish: | |
| Anatomical Term: | |
| Stage Range: | 1-cell to Day 4 |
Expression Detail
Antibody Labeling
Phenotype Data
Phenotype Detail
Acknowledgments
This image is the copyrighted work of the attributed author or publisher, and
ZFIN has permission only to display this image to its users.
Additional permissions should be obtained from the applicable author or publisher of the image.
Reprinted from Gene expression patterns : GEP, 9(4), Burzynski, G.M., Delalande, J.M., and Shepherd, I., Characterization of spatial and temporal expression pattern of SCG10 during zebrafish development, 231-237, Copyright (2009) with permission from Elsevier. Full text @ Gene Expr. Patterns