
FIGURE
Fig. 5
- ID
- ZDB-FIG-090304-23
- Publication
- Boehmler et al., 2009 - Identification of zebrafish A2 adenosine receptors and expression in developing embryos
- Other Figures
- All Figure Page
- Back to All Figure Page
Fig. 5
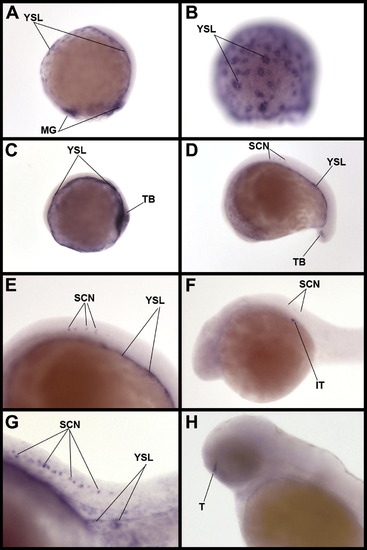
Expression of the adora2a.2 gene. Lateral view of embryos at (A) gastrulation, (B) gastrulation, focussing on the lateral part of the YSL and showing accumulation of transcripts in perinuclear area of the YSL, (C) early somitogenesis (11 hpf), (D–E) mid-somitogenesis (15 hpf) with (E) focussing on the trunk region of the embryo, (F–G) 24 hpf, with (G)focussing on the trunk region, (H) 48 hpf. IT, interrenal tissue; MG, margin; SCN, spinal cord neurons; T, telencephalon; TB, tail bud; YSL, yolk syncytial layer. |
Expression Data
| Gene: | |
|---|---|
| Fish: | |
| Anatomical Terms: | |
| Stage Range: | 50%-epiboly to Long-pec |
Expression Detail
Antibody Labeling
Phenotype Data
Phenotype Detail
Acknowledgments
This image is the copyrighted work of the attributed author or publisher, and
ZFIN has permission only to display this image to its users.
Additional permissions should be obtained from the applicable author or publisher of the image.
Reprinted from Gene expression patterns : GEP, 9(3), Boehmler, W., Petko, J., Woll, M., Frey, C., Thisse, B., Thisse, C., Canfield, V.A., and Levenson, R., Identification of zebrafish A2 adenosine receptors and expression in developing embryos, 144-151, Copyright (2009) with permission from Elsevier. Full text @ Gene Expr. Patterns