
Fig. 2
- ID
- ZDB-FIG-090224-61
- Publication
- Xiang et al., 2009 - Identifying tumor cell growth inhibitors by combinatorial chemistry and zebrafish assays
- Other Figures
- All Figure Page
- Back to All Figure Page
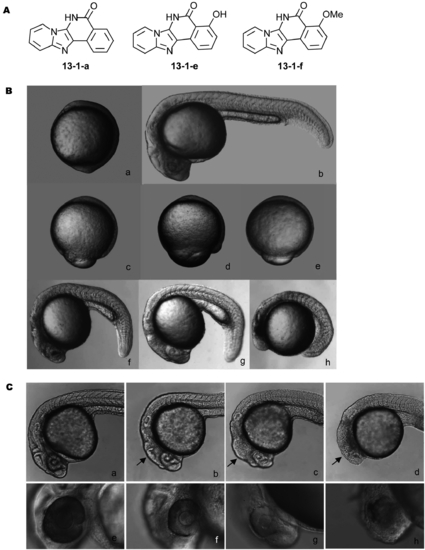
Representative active compounds and resulted phenotypes. (A) Representative active compounds. Compounds 13-1-a, 13-1-e and 13-1-f are the most potent in zebrafish assay with the lowest effective concentration below 10 μM. (B) Embryonic phenotypes of compound treatment. a) control (10 hpf), b) control (24 hpf); c–e) show embryos treated with 20 μmol/L of 13-1-a (c), 13-1-e (d), and 13-1-f (e) and observed at 10 hpf (compounds were added at 5.5 hpf); f–h) show embryos at 24 hpf after the same treatment [13-1-a (f), 13-1-e (g), 13-1-f (h)]. Note smaller sizes compared control. (C) Compound 13-1-e has stronger effect on brain and eye development of zebrafish embryos. a) control (24 hpf), b) 13-1-e (20 μmol/L), c) 13-1-e (30 μmol/L), d) 13-1-e (40 μmol/L), 24 hpf; e) control (36 hpf), f) 13-1-e (20 μmol/L), g) 13-1-e (30 μmol/L), h) 13-1-e (40 μmol/L), 36 hpf. Compounds were added at 5.5 hpf. |
| Fish: | |
|---|---|
| Conditions: | |
| Observed In: | |
| Stage Range: | Bud to Prim-5 |