
Fig. 1
- ID
- ZDB-FIG-090224-36
- Publication
- Fischer et al., 2009 - Local Cortical Tension by Myosin II Guides 3D Endothelial Cell Branching
- Other Figures
- All Figure Page
- Back to All Figure Page
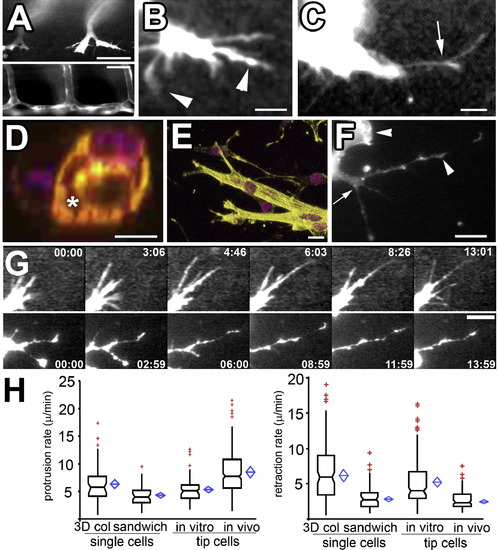
ECs in Vivo and in 3D Collagen Matrices in Vitro Exhibit Similar Pseudopodial Morphology and Dynamics (A–C) Confocal images of living ECs expressing GFP during zebrafish embryonic angiogenesis (see Movie S1). Intersegmental vessels ([A], bottom), 7 days after fertilization, form from branched tip ECs ([A], top, 24 hr after fertilization). (B) and (C) show higher-magnification views of living tip ECs (Movies S1 and S3). Arrows indicate branch points along pseudopodia; arrowheads indicate tip and side lamellipodia-like bulges. Scale bars in (A) represent 40 μm and 80 μm (top and bottom, respectively). Scale bars in (B) and (C) represent 21 μm. (D) Cross-section of mouse endothelial tube structure formed in 3D collagen matrices: violet, DAPI-stained nuclei; yellow, phalloidin-stained F-actin; asterisk, lumen formed between cells. The scale bar represents 10 μm. (E) Three-dimensional reconstructions of mouse endothelial tube tips formed in 3D collagen. The scale bar represents 12 μm. (F) Confocal image of living mouse aortic ECs expressing GFP-β-actin in a 3D collagen matrix. Branch points (indicated by an arrow) and lamellipodia (indicated by arrowheads) and bulges along pseudopodia are highlighted. The scale bar represents 31 μm. (G) Images from time-lapse confocal series showing protrusion dynamics of zebrafish tip ECs in vivo (top) and in mouse ECs in 3D collagen matrices in vitro (bottom); time in min:s is shown. The scale bar represents 12 μm. (H) Protrusion (left graph) and retraction rates (right graph) of pseudopodia of single ECs or tube tip cells in 3D collagen matrices (“3D col”), 450 kPa collagen/PA/glass sandwich gels (“sandwich”), and zebrafish tip ECs in vivo. In this and subsequent figures, boxes represent median and center quartiles, blue diamonds represent 95% confidence limit means, and red plusses represent outliers of >1.5 and <3.0 interquartile range. For statistical analysis, see Table S1. |
| Gene: | |
|---|---|
| Fish: | |
| Anatomical Term: | |
| Stage Range: | Prim-5 to Days 7-13 |