
Fig. 2
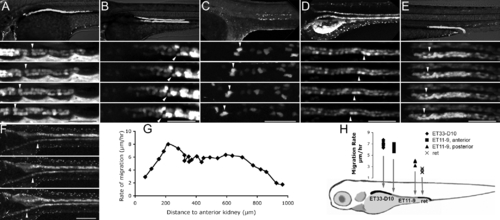
Pronephric Epithelial Cells Migrate toward the Glomerulus Individual frames of confocal fluorescent time-lapse videos at 2.5-h intervals are presented for five different kidney GFP transgenics. White arrowheads in (A–F) mark individual cells at different time points in migration. (A) ET33-D10 GFP transgenic (proximal segment).(B) ET11–9 GFP transgenic (mid segment). (C) CD41:GFP transgenic, multiciliated cells, mid kidney. (D) NaK ATPase:GFP transgenic, all transporting epithelia. (E) ret1:GFP transgenic, distal collecting segment. (F) NaK ATPase:GFP transgenic. Small arrows mark the convolutions forming in the proximal tubules. (G) The rate of migration in (F) is plotted as a function of the distance from proximal-most kidney. (H) Rates of migration determined for various segments of the kidney. The upper panels in (A), (B), (D), and (E) show live GFP transgenics. The upper panel in (C) shows immunofluorescent image using anti-GFP tagged antibody. The scale bar lengths are as follows: (A), (B), (D), (E): 80 μm, (C): 60 μm, (F): 200 μm. Inter-frame time interval is 2.5 h in (A–E) and 10 h in (F). The rate of migration is measured between 2 and 2.5 dpf in (G) and between 2.5 and 3 dpf in (H). |
| Genes: | |
|---|---|
| Fish: | |
| Anatomical Term: | |
| Stage Range: | Long-pec to Protruding-mouth |